
Bollinger Bands, developed by John Bollinger, showcase market volatility and potential trend reversals using a system of moving averages and standard deviations. Traders utilize these bands to pinpoint entry/exit points and overbought/oversold conditions. Tightening bands suggest imminent price movements, aiding in decision-making. Understanding Bollinger Bands enhances analytical prowess and decision-making skills in financial markets. Bollinger Bands are a cornerstone in technical analysis due to their ability to visualize market behavior effectively. For a thorough understanding of how to navigate these bands effectively and their implications in trading strategies, a detailed guide is essential.
Key Takeaways
Highlighting the fundamental principles of Bollinger Bands, the key takeaways encapsulate essential insights for market analysis and decision-making.
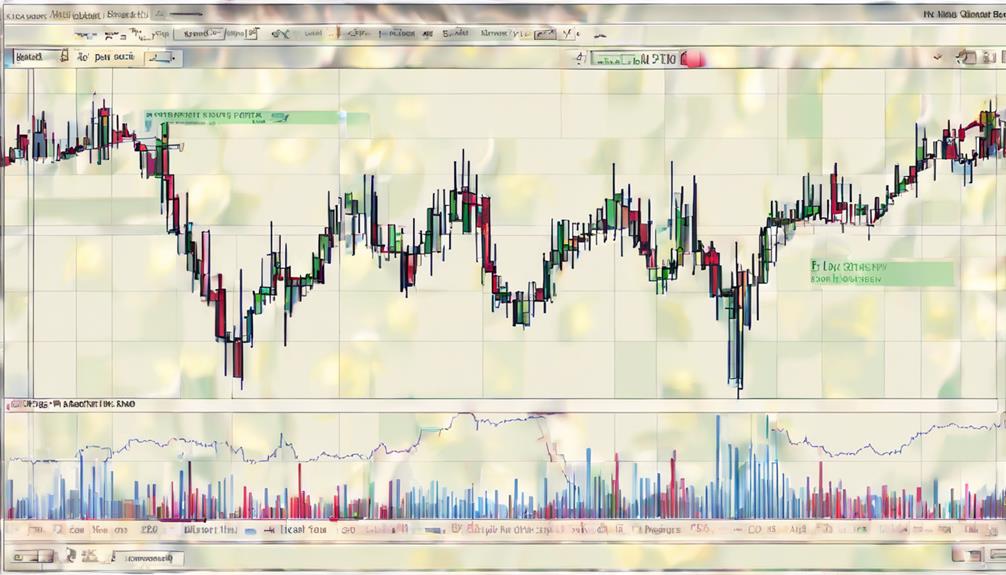
Bollinger Bands, consisting of a middle band (Simple Moving Average) and upper and lower bands set by standard deviations, serve as a valuable tool for traders and analysts. The bands' ability to widen during periods of increased volatility and narrow during low volatility provides a visual representation of market fluctuations. By pinpointing overbought and oversold conditions, Bollinger Bands offer traders cues to potential trend reversals or continuations. The behavior of the bands, especially when they tighten, can signal periods of consolidation and impending significant price movements.
Understanding Bollinger Bands goes beyond merely recognizing the upper and lower boundaries; it explores the intricacies of market behavior and the insights derived from price movements. By comprehending the dynamics of Bollinger Bands, traders can enhance their analytical capabilities and make informed decisions based on the signals generated by this technical analysis tool.
Who Is John Bollinger?

John Bollinger is a highly respected figure in the world of technical analysis and finance, credited with creating the Bollinger Bands indicator. His expertise and contributions have greatly influenced how traders and investors analyze market trends and volatility.
Through the development of Bollinger Bands, John Bollinger has left a lasting impact on the field of technical analysis.
Bollinger's Background and Expertise
Recognized as the visionary behind the creation of Bollinger Bands, John Bollinger is a distinguished financial analyst, author, and the founder of Bollinger Capital Management. Bollinger Bands, a cornerstone of technical analysis, were developed by Bollinger in the 1980s to offer insights into market volatility, trends, and potential price reversals.
His expertise in technical analysis has positioned him as a leading figure in the financial industry, with Bollinger Bands becoming a standard tool for traders and investors worldwide. Through his work, John Bollinger has greatly influenced the way market participants analyze and interpret price movements, providing them with a valuable framework for understanding market dynamics and making informed trading decisions.
Impact on Technical Analysis
With a pioneering approach to technical analysis, John Bollinger's development of Bollinger Bands in the 1980s has profoundly influenced market analysis methodologies and trading strategies worldwide.
Bollinger Bands settings, established by Bollinger, offer a unique perspective on market behavior by measuring volatility and identifying trends. This technical analysis tool, created by John Bollinger, provides traders and investors with valuable insights into price movements, helping them make informed decisions.
By introducing Bollinger Bands to the trading community, John Bollinger revolutionized the way market participants analyze data and develop trading strategies.
The impact of Bollinger Bands on technical analysis has been significant, shaping the way professionals interpret market dynamics and formulate effective trading approaches.
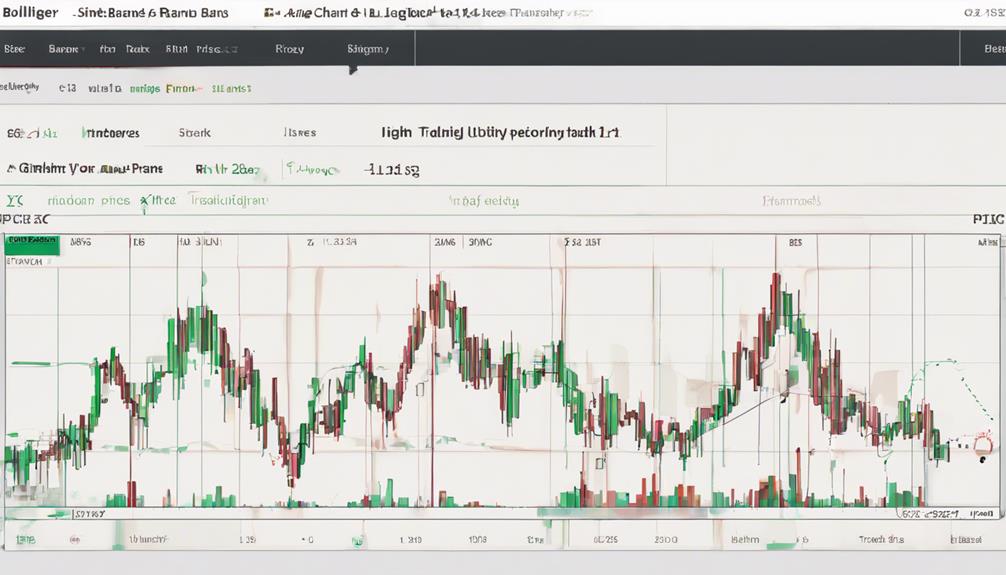
Constructing Bollinger Bands
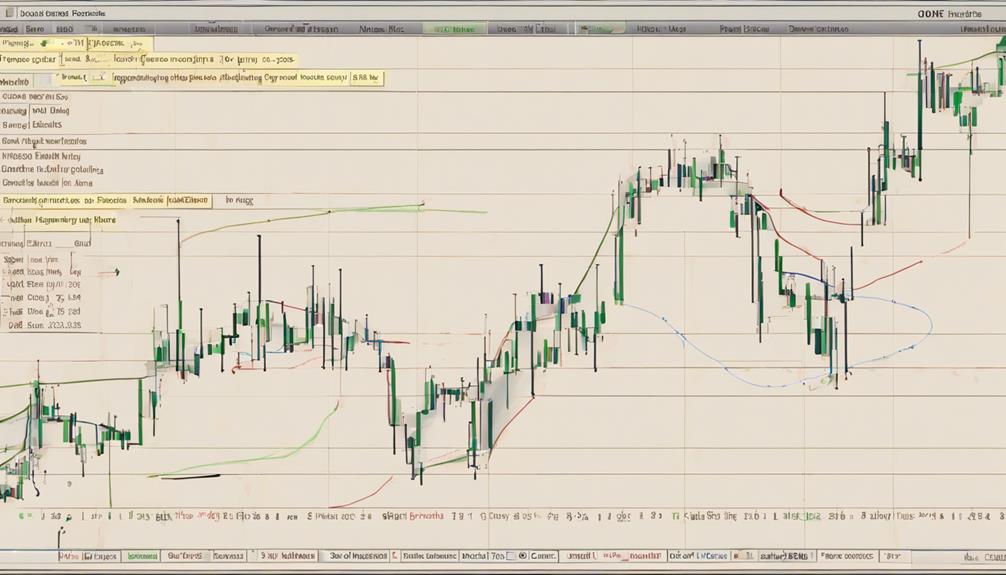
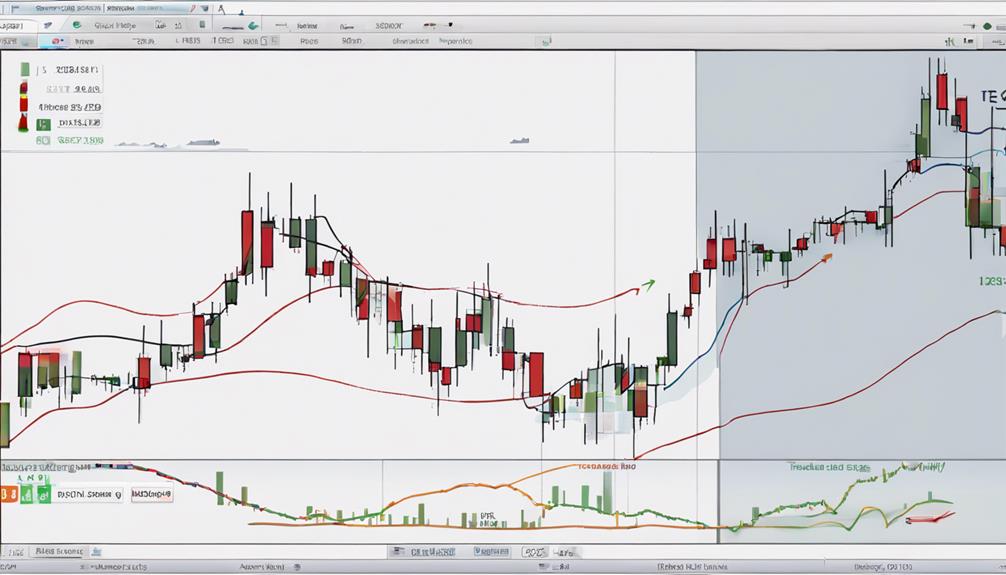
To construct Bollinger Bands effectively, traders calculate a simple moving average along with upper and lower bands that are based on standard deviations. The upper and lower bands are typically set at two standard deviations from the 20-period simple moving average. These bands widen and narrow based on the asset's volatility, with wider bands indicating higher volatility levels. Bollinger Bands play an essential role in helping traders identify potential overbought and oversold conditions in the market. Constructing Bollinger Bands involves calculating the simple moving average, upper band, and lower band to visualize price volatility. Below is a table summarizing the key components of Bollinger Bands:
| Component | Description |
|---|---|
| Simple Moving Average (SMA) | Middle band representing the average price over a specified period |
| Upper Band | Calculated by adding two standard deviations to the SMA to capture price highs |
| Lower Band | Calculated by subtracting two standard deviations from the SMA to capture price lows |
| Volatility | Reflected by the width of the bands, with wider bands indicating higher volatility |
How To Trade With Bollinger Bands
When trading with Bollinger Bands, it is important to understand various strategies that can be employed based on the indicator's signals.
Traders can interpret Bollinger Bands to identify potential entry and exit points, as well as to gauge market volatility and overbought or oversold conditions.
Utilizing these insights effectively can help traders make informed decisions and capitalize on market opportunities.
Trading Strategies
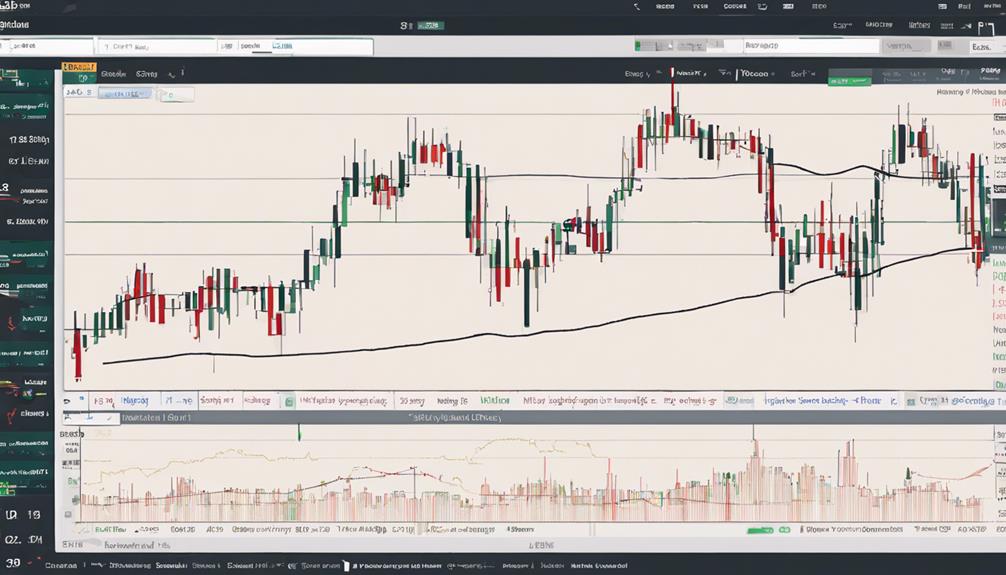
Utilizing Bollinger Bands in trading provides valuable insights for traders seeking to identify market conditions and formulate effective strategies. Traders often use the moving average and the upper and lower bands to gauge market volatility and determine entry and exit points. The bands' ability to indicate overbought and oversold conditions assists in making informed trading decisions. Setting price targets based on Bollinger Bands can be particularly useful for mean reversion strategies. Additionally, these bands can adapt to changes in volatility, providing traders with critical information for market analysis and risk management.
| Key Concepts | Description |
|---|---|
| Moving Average | Helps gauge trend strength. |
| Upper and Lower Bands | Indicates overbought/oversold conditions. |
| Volatility | Reflects market volatility, aiding in entry and exit points. |
| Price Targets | Useful for setting targets, especially in mean reversion strategies. |
| Risk Management | Assists in analyzing market conditions for better risk management strategies. |
Indicator Interpretation
An essential aspect of trading with Bollinger Bands involves interpreting the indicators effectively to make informed decisions in the financial markets. When utilizing Bollinger Bands for trading, consider the following:
- Bollinger Bands help identify overbought conditions at the upper band.
- Traders can use Bollinger Bands to pinpoint potential price reversals.
- The lower band indicates oversold conditions and can be a reference point for reversals.
Understanding these key points allows traders to navigate market volatility, anticipate price reversals, and gauge potential price moves accurately.
Moves Within the Bands
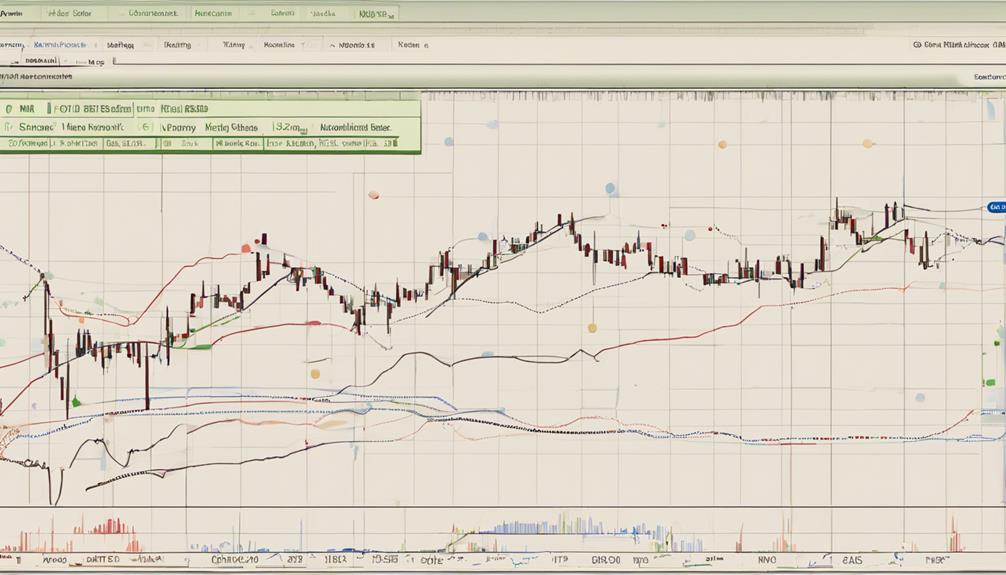
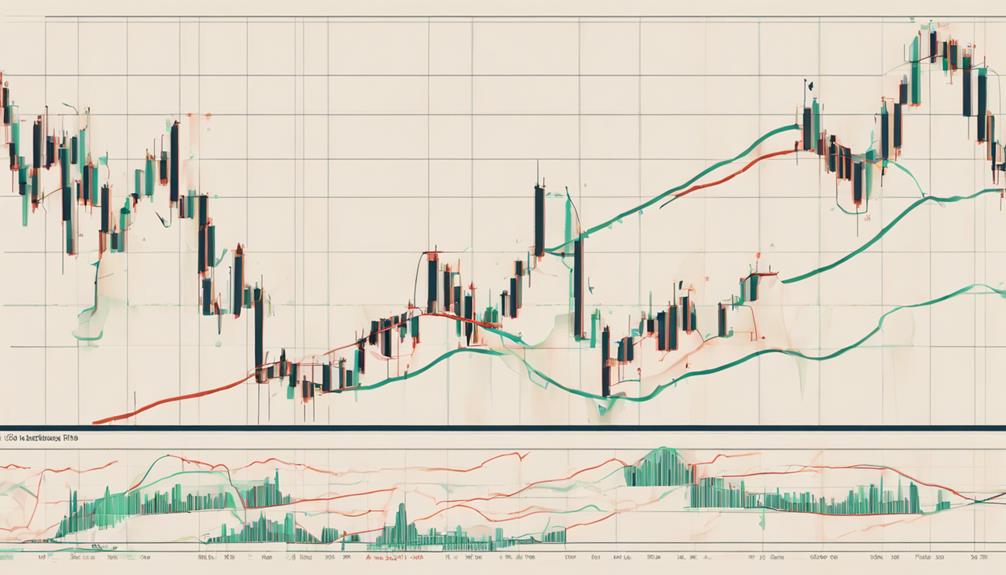
Movements within the Bollinger Bands serve as key indicators of price fluctuation patterns within a defined volatility range. Within these bands, prices exhibit normal fluctuations, providing traders with insights into market sentiment and trend strength. Traders often observe price bounces off the bands, considering these points as potential signals for entering or exiting positions. By analyzing price interactions within the bands, traders can gauge the level of market activity and the extent of price discovery taking place.
Understanding price movements within the Bollinger Bands is vital for traders seeking to make informed decisions based on the dynamics of the market. Continuous price movements within the bands suggest ongoing market activity and the potential for further price discovery. By closely monitoring these movements, traders can enhance their understanding of the market environment and adapt their strategies accordingly to capitalize on evolving price movements.
Signals at the Upper Band
Signaling potential overbought conditions, the Upper Band in Bollinger Bands serves as a critical indicator for traders evaluating market dynamics. When focusing on signals at the Upper Band, traders should consider the following:
- Identifying Overbought Conditions: A breach of the Upper Band often indicates overbought conditions in the market, suggesting that prices may be too high and due for a correction.
- Evaluating Momentum and Volatility: Traders use Upper Band signals to gauge the strength of the current momentum. A slowdown in momentum near the Upper Band could signal a potential price reversal. Additionally, breaching the Upper Band may hint at increasing volatility.
- Setting Price Targets and Gauging Trend Reversals: Upper Band signals can assist in setting price targets for mean reversion strategies. They also help traders assess the strength of an ongoing trend and the potential for a reversal based on price movements near the Upper Band.
Signals at the Lower Band
The Lower Band in Bollinger Bands serves as a critical level that traders closely monitor for potential signals.
Breakouts below the Lower Band can indicate oversold conditions and the possibility of a bearish trend forming.
Traders often look for reversal patterns and buying opportunities near the Lower Band to capitalize on mean reversion strategies.
Lower Band Breakouts
Lower band breakouts in Bollinger Bands are key indicators of potential oversold market conditions, often signaling opportunities for mean reversion and trend reversals. When the price breaks below the lower band, traders interpret this as a signal of increased volatility and a potential buying opportunity for mean reversion strategies.
It can also serve as a target for traders looking to capitalize on a potential reversal in the current downtrend. However, a breakout below the lower band can also indicate the beginning of a bearish trend, prompting traders to reassess their positions and strategies accordingly.
Lower band breakouts hold valuable information for traders seeking to navigate market dynamics effectively.
Reversal Patterns Detected
Breaking below the lower band in Bollinger Bands can reveal essential reversal patterns detected at the lower band, offering valuable insights into potential market shifts. When prices touch or breach the lower band, it often indicates oversold conditions, prompting traders to anticipate mean reversion and potential buying opportunities.
The presence of price action near the lower band suggests increased downward volatility in the asset, potentially signaling the beginning of a bearish trend. Traders keen on identifying reversal patterns at the lower band should pay close attention to the signals generated, as they can provide critical information for decision-making in the market. Understanding these dynamics can help traders navigate market uncertainties more effectively.
What Widening Bands Mean
Amidst market fluctuations, widening bands serve as an important indicator of heightened volatility and potential price movements. When Bollinger Bands widen, they convey essential information to market participants:
- Increased Volatility: Widening bands suggest that market volatility is on the rise, indicating the potential for more significant price swings.
- Significant Price Trends: The widening of the bands often marks the beginning of substantial price trends, presenting traders with opportunities to capitalize on these movements.
- Potential Breakout: During a squeeze, widening bands hint at a potential breakout, signaling a shift in the current trend and the emergence of a new trend.
Traders should take note of widening bands as they present opportunities for significant gains, but it is important to tread cautiously as the risk of greater losses also accompanies this scenario. It is advisable for market participants to reassess their risk management strategies when bands widen, ensuring they are prepared for any market developments that may arise.
What Tightening Bands Mean
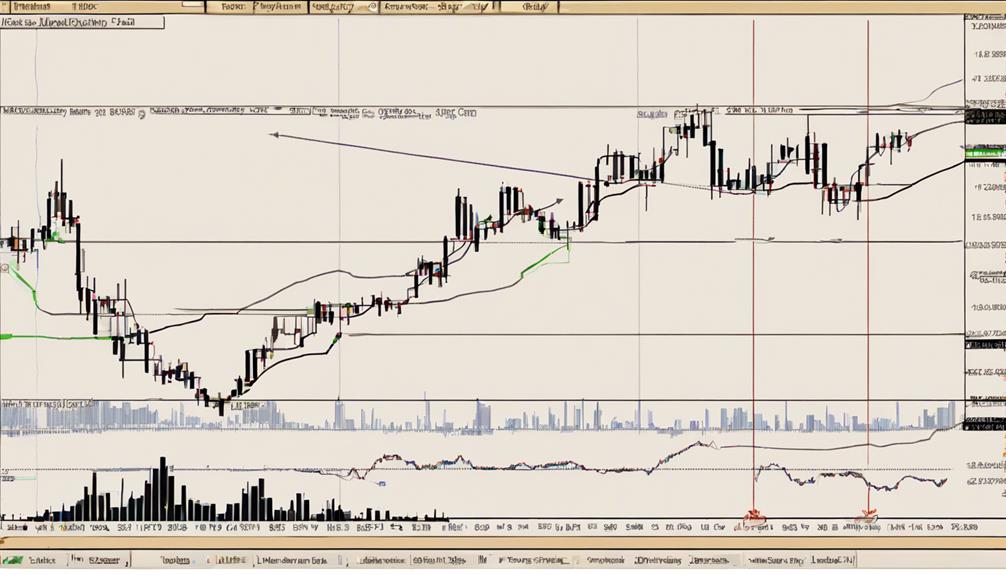
Following the implications of widening Bollinger Bands, a shift to tightening bands signifies a period of decreased volatility and consolidation within the market. Tightening bands suggest a reduction in price fluctuations and the narrowing of price ranges, indicating a potential upcoming major price move or breakout.
This period of consolidation often reflects a lack of consensus among market participants regarding the next direction of the asset's price. Traders closely monitor tightening bands as they are considered a pivotal precursor to significant market movements.
During such phases, traders typically adjust their risk management strategies to prepare for potential increased volatility and major price swings. Recognizing tightening bands is vital for traders as it can help them anticipate and position themselves for potential breakouts or major price shifts.
How Reliable Are Bollinger Bands?
The reliability of Bollinger Bands in technical analysis is contingent upon various factors such as asset characteristics, parameter settings, and prevailing market conditions. To understand how reliable Bollinger Bands are, consider the following:
- Asset Characteristics: Each asset has unique volatility patterns that can impact the effectiveness of Bollinger Bands in predicting price movements.
- Adjusting Parameters: Tweaking settings like the Simple Moving Average (SMA) period and standard deviations can improve the accuracy of Bollinger Bands in signaling potential buy or sell opportunities.
- Combining with Other Indicators: Integrating Bollinger Bands with complementary technical indicators can enhance their reliability by providing confirmation signals and reducing false alarms.
While Bollinger Bands are a valuable tool for traders, relying solely on them may not always lead to optimal results due to potential false signals and their tendency to lag behind actual price movements. By considering these factors and integrating Bollinger Bands with other indicators, traders can improve the effectiveness of their technical analysis and make more informed trading decisions.
What Technical Indicators Are Similar to Bollinger Bands?

Considering the similarities in functionality and purpose, several technical indicators closely resemble Bollinger Bands in their approach to analyzing price movements and market conditions. The Relative Strength Index (RSI) and Moving Average Convergence Divergence (MACD) are both momentum oscillators that assess the momentum and speed of price movements, akin to Bollinger Bands. Similarly, the Stochastic Oscillator compares a security's closing price to its price range over a specific period, providing insights into market momentum similar to Bollinger Bands. Average True Range (ATR) measures market volatility by calculating the average range between high and low prices, offering information similar to Bollinger Bands. Keltner Channels, on the other hand, use volatility to establish channel boundaries around an exponential moving average to capture price movements effectively. Below is a table summarizing these technical indicators:
| Technical Indicator | Description |
|---|---|
| Relative Strength Index (RSI) | Measures speed and change of price movements |
| Moving Average Convergence Divergence (MACD) | Identifies trends and momentum shifts through moving averages |
| Stochastic Oscillator | Compares a security's closing price to its price range over a specific period |
| Average True Range (ATR) | Calculates the average range between high and low prices to measure market volatility |
| Keltner Channels | Sets channel boundaries around an exponential moving average using volatility to capture price movements |
What Are Some Limitations To Using Bollinger Bands?
One significant drawback of utilizing Bollinger Bands in technical analysis is their tendency to lag behind fast-moving market conditions, potentially impeding timely decision-making. When considering the limitations of Bollinger Bands, it is essential to acknowledge the following:
- False Signals: In volatile market conditions, Bollinger Bands can produce false signals due to abrupt price changes, leading to erroneous trading decisions.
- Need for Adjustments: Standard settings of Bollinger Bands may not be universally applicable, necessitating adjustments based on asset characteristics and prevailing market conditions for accurate analysis.
- Dependency on Other Indicators: Relying solely on Bollinger Bands for trading decisions may pose risks, as they are more effective when used in conjunction with other indicators to enhance risk management strategies and ensure thorough analysis.
While Bollinger Bands offer valuable insights into price volatility and potential trend reversals, their limitations highlight the importance of incorporating additional analysis and tools to make informed trading decisions.
Frequently Asked Questions
How Do You Interpret the Bollinger Bands?
Interpreting Bollinger Bands involves analyzing trend reversals, volatility, price action, support, and resistance levels.
Traders use moving averages within the bands to assess market conditions and develop trading strategies.
The bands expanding suggest increased volatility, while narrowing indicates decreased volatility.
Understanding these dynamics helps traders make informed decisions based on the price action within the bands.
How Do You Use Bollinger Bands Effectively?
To use Bollinger Bands effectively, traders must incorporate various trading strategies based on volatility indicators, trend analysis, technical analysis, and risk management principles.
These bands provide valuable insights into entry points, exit signals, price action, and market psychology.
What Does 20 2 Mean in Bollinger Bands?
In Bollinger Bands, '20, 2' refers to a 20-period simple moving average (SMA) and 2 standard deviations for the upper and lower bands. This setting is a key component of the bands, serving as a volatility indicator and establishing price boundaries.
Traders utilize these parameters in technical analysis for stock trading or the Forex market to evaluate price movements relative to the SMA, aiding in identifying potential trading opportunities based on deviations from the average.
What Is the Best Timeframe for Bollinger Bands?
The optimal timeframe for Bollinger Bands varies based on the trading style and goals. For short-term analysis and intraday trading, using a shorter timeframe like 10 periods can provide more sensitive signals.
Conversely, swing traders looking for long-term strategies may opt for longer timeframes like 50 periods to capture broader trends.
It's essential to align the timeframe with your trading approach, risk tolerance, and the asset's volatility for effective trend identification and market timing.
Conclusion
To sum up, Bollinger Bands offer traders a valuable tool for analyzing market trends and potential trading opportunities. While they are widely used and respected in the financial industry, it is important to remember that no indicator is foolproof.
Traders should exercise caution and use Bollinger Bands in conjunction with other technical analysis tools to make informed decisions. Remember, even the best tools have their limitations – don't rely on Bollinger Bands alone for success in the markets.