
Mastering the Relative Strength Index (RSI), Moving Average Convergence Divergence (MACD), and Bollinger Bands is vital for traders. RSI gauges price momentum and overbought/oversold conditions. MACD combines moving averages to spot trend shifts, using crossovers as key signals. Bollinger Bands help by showing price volatility and potential breakouts. These indicators provide essential insights into market dynamics and potential trade setups, empowering traders with valuable information for decision-making. Understanding and applying these indicators can greatly enhance one's trading strategy and overall performance in the market.
Key Trend Indicators Overview
The in-depth analysis of market trends necessitates a deep understanding of key trend indicators such as RSI, MACD, and Bollinger Bands. These technical indicators play an essential role in helping traders interpret market dynamics and make informed decisions.
The Relative Strength Index (RSI) is a momentum oscillator that measures the speed and change of price movements. It helps traders identify overbought or oversold conditions in an asset, signaling potential reversal points.
Moving Average Convergence Divergence (MACD), on the other hand, combines moving averages to provide insights into trend changes and momentum shifts in asset prices.
Lastly, Bollinger Bands utilize standard deviations to depict volatility and potential price breakouts in the market. By analyzing these indicators collectively, traders can gain a thorough view of market trends, enabling them to anticipate potential price movements and optimize their trading strategies for better outcomes.
Bollinger Band (BB) Indicator
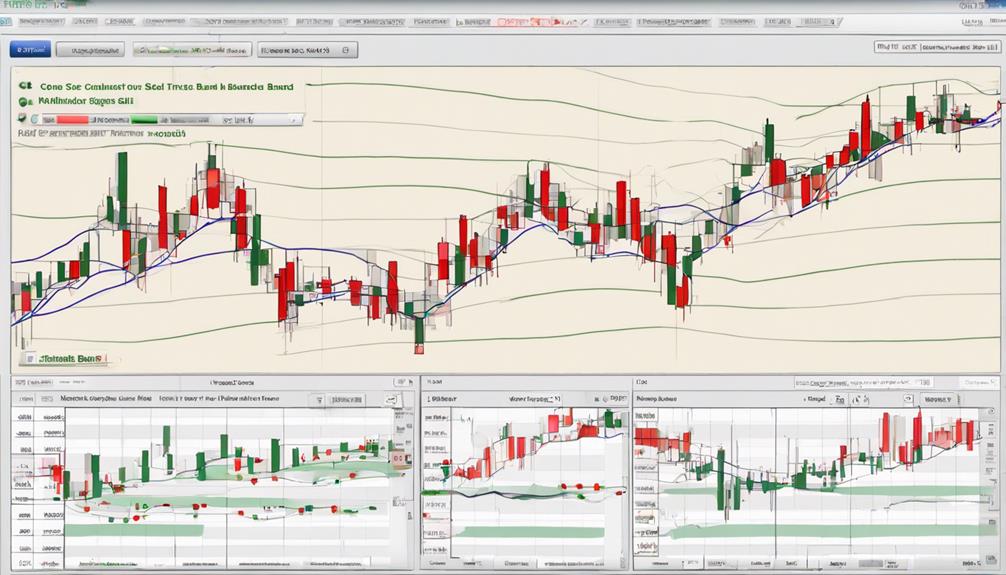
Exploring the Bollinger Band (BB) Indicator reveals a tool that leverages standard deviation to establish upper and lower bands around a moving average, aiding traders in identifying volatility and potential price reversals in assets.
- The BB Indicator utilizes standard deviation to create these bands, offering a visual representation of price volatility.
- The width of the bands is indicative of the level of volatility in the market, with wider bands signaling higher volatility levels.
- When prices touch or surpass the bands, it could suggest overbought or oversold conditions, potentially indicating a reversal in prices.
- Traders often use the BB Indicator to assess market conditions, foresee potential breakouts, or anticipate reversals in price trends. By understanding the upper and lower bands' significance in relation to the asset's price movements, traders can make informed decisions regarding their positions in the market.
Moving Average Convergence Divergence (MACD) Indicator
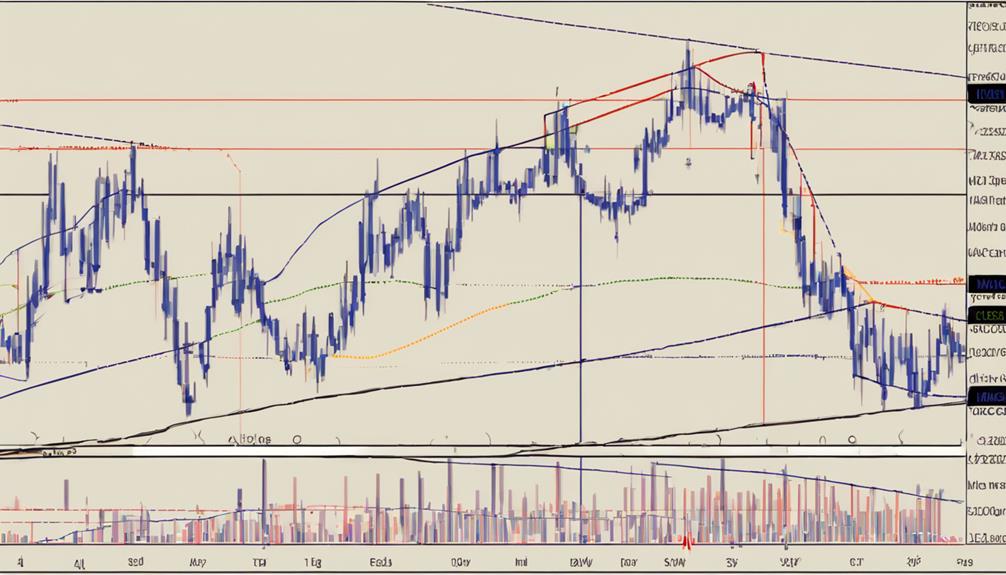
Utilizing exponential moving averages, the Moving Average Convergence Divergence (MACD) Indicator is a powerful tool employed by traders to analyze asset price momentum and identify potential trend changes.
The MACD indicator consists of a MACD line, a signal line, and a histogram, offering a thorough view for trend analysis. Traders often focus on MACD crossovers and divergences between the MACD line and the signal line to generate buy/sell signals.
When the bars in the MACD histogram are above zero, it suggests a potential uptrend, whereas bars below zero indicate a potential downtrend.
Personalizing analysis preferences is possible by adjusting MACD settings on trading platforms like thinkorswim.
Are the Trend Indicators in Forex Trading Also Essential for Other Types of Trading?
Yes, essential forex technical indicators are important for other types of trading as well. While specifically designed for forex trading, trend indicators can also be useful in other markets to identify and capitalize on market trends. Traders in various markets can benefit from the insight provided by these indicators.
How Can Trend Indicators Help Me Predict Changes in the Hang Seng Index?
Trend indicators are crucial for predicting changes in the Hang Seng Index. By analyzing the various factors affecting Hang Seng Index, such as market sentiment, economic data, and geopolitical events, trend indicators can provide valuable insight into potential shifts in the index. This information helps investors make informed decisions.
Frequently Asked Questions
What Are the Top 3 Tradingview Indicators?
When considering the top 3 Tradingview indicators:
- Moving Averages, Bollinger Bands, and Relative Strength Index (RSI) emerge as key tools for technical analysis and trend identification.
- Moving Averages smooth out price data to reveal trends, while Bollinger Bands indicate volatility and potential price extremes.
- RSI helps traders identify overbought or oversold conditions, guiding decision-making.
- These indicators play an essential role in assisting traders in making informed trading decisions based on market trends and conditions.
What Is the Best Indicator for Trend Trading?
When considering the best indicator for trend trading, moving averages are a fundamental tool. They provide a smooth representation of price trends over time.
Relative strength can also be vital, indicating the momentum behind a trend.
Additionally, MACD divergence is highly effective in identifying potential trend reversals.
Integrating these indicators into a thorough analysis can enhance trend trading strategies by providing valuable insights into market dynamics and potential opportunities.
What Is the Most Powerful Indicator in Trading?
The most powerful indicator in trading is subjective and varies based on individual trading strategies and preferences.
However, many traders consider the Moving Average Convergence Divergence (MACD) as a highly effective tool for identifying trends and momentum in the market.
What Is the Best Leading Indicator for Trading?
When considering the best leading indicator for trading, the Moving Average Convergence Divergence (MACD) stands out for its ability to identify trend direction and momentum shifts through signal line crossovers.
MACD histogram bars above the zero line indicate potential uptrends, offering early signals to traders. By adjusting settings to match trading preferences and timeframes, traders can enhance trend analysis accuracy.
MACD's combination of trend identification and timing makes it a valuable tool for capturing market movements.
Conclusion
To summarize, comprehending the key trend indicators like Bollinger Bands and MACD can greatly benefit traders in identifying potential market trends and making informed trading decisions.
These indicators provide valuable insights into market movements and help traders navigate the complexities of the financial markets.
Just as a compass guides a sailor through rough waters, these trend indicators serve as tools to steer traders towards profitable opportunities in the ever-changing landscape of trading.