
Master the CCI indicator by understanding its momentum-based oscillation and trend assessment abilities. Utilize its signals for buy/sell opportunities and trend strength identification by interpreting readings above +100 as overbought and below -100 as oversold. Enhance accuracy by combining CCI with other indicators and setting up stop-loss orders strategically. Avoid common mistakes, confirm signals with complementary tools, and backtest for performance evaluation. Grow profitability by incorporating moving averages, support/resistance levels, and risk management techniques. Validate CCI signals by cross-referencing with technical indicators and chart patterns. Elevate your day trading with CCI for precise entries and exits, highlighting the potential for quick profit gains.
CCI Indicator Overview
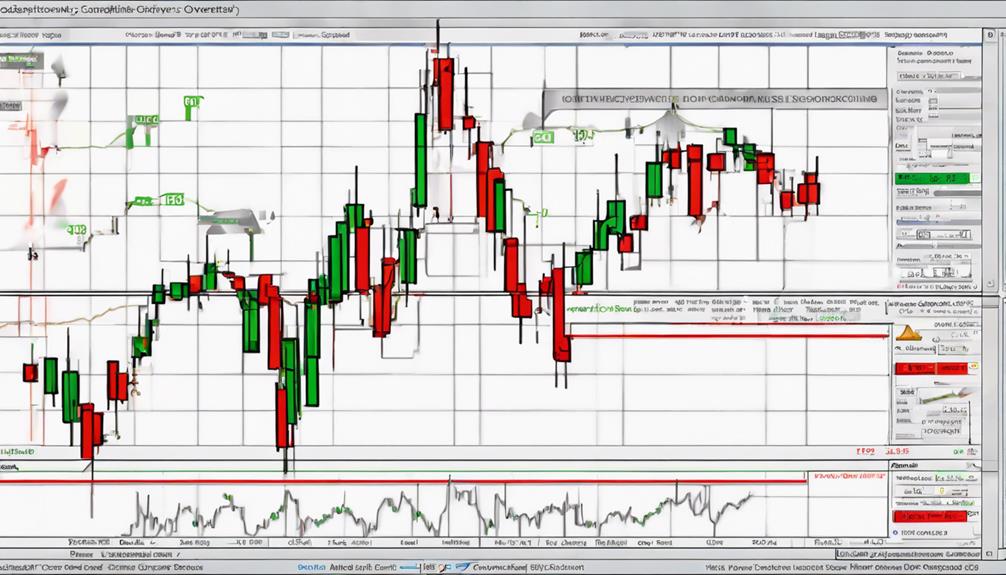
Developed by Donald Lambert in the 1980s, the Commodity Channel Index (CCI) serves as a momentum-based oscillator used by traders to assess overbought and oversold market conditions. By comparing the current price to historical averages, the CCI indicator helps identify potential trend reversals and trend strength. CCI values fluctuate around a central zero line, with readings above +100 signaling overbought conditions and below -100 indicating oversold conditions. Traders utilize the CCI indicator to generate buy or sell signals and make informed decisions on entry and exit points in various markets such as stocks, forex, and commodities.
The CCI indicator's ability to highlight extreme price levels relative to historical averages makes it a valuable tool for traders seeking to capitalize on market trends. Understanding the nuances of overbought and oversold conditions can provide traders with a competitive edge in maneuvering volatile market environments and optimizing their trading strategies.
CCI Calculation Method
The calculation method of the CCI indicator revolves around key components such as the typical price, simple moving average, and mean deviation. These elements work in tandem to provide traders with valuable insights into potential overbought or oversold conditions.
CCI Formula Basics
Understanding the CCI formula basics is essential for mastering the CCI indicator in technical analysis. The Commodity Channel Index (CCI) formula involves calculating the Typical Price, Simple Moving Average (SMA), and Mean Deviation. Here are key points to keep in mind:
- Typical Price: This is the average of high, low, and close prices.
- Simple Moving Average (SMA): Calculated over a specific period, often 20 days.
- Mean Deviation: Measures the average deviation of prices from the SMA.
- Identifying Overbought and Oversold Conditions: These components help in determining CCI values to identify potential overbought and oversold conditions in the market.
Interpreting CCI Readings
When analyzing CCI readings, it is important to consider the calculation method. The formula for CCI involves deriving the indicator value based on the relationship between the typical price, simple moving average, and mean deviation. This formula, (TP – SMA) / (0.015 * MD), where TP is the typical price, SMA is the simple moving average, and MD is the mean deviation, plays a crucial role in interpreting CCI readings.
The typical price represents the average price, the simple moving average is the average of typical prices over a specified period, often 20 days, and the mean deviation measures the average deviation of typical prices from the SMA over the same period. CCI fluctuates around zero, with readings above +100 indicating overbought conditions and readings below -100 indicating oversold conditions.
Interpreting CCI Signals
Analyzing CCI signals allows traders to gauge signal strength and identify potential trend reversals. Understanding the implications of readings above +100 or below -100 is important for making informed trading decisions.
Additionally, combining CCI signals with other indicators can provide a more thorough view of market conditions and improve overall trading accuracy.
Signal Strength Analysis
In evaluating market dynamics through the CCI indicator, signals above +100 signify robust buying momentum and potential upward movements, while signals below -100 indicate substantial selling pressure and the potential for downtrends.
When analyzing signal strength using the CCI indicator, consider the following key points:
- CCI signals above +100 suggest strong buying momentum.
- Signals below -100 indicate significant selling pressure.
- Extreme readings above +200 or below -200 confirm notable market movements.
- Divergence between price and CCI can signal trend reversals or weakening momentum.
- Combining CCI signals with other technical indicators enhances signal accuracy and reliability.
Trend Reversal Identification
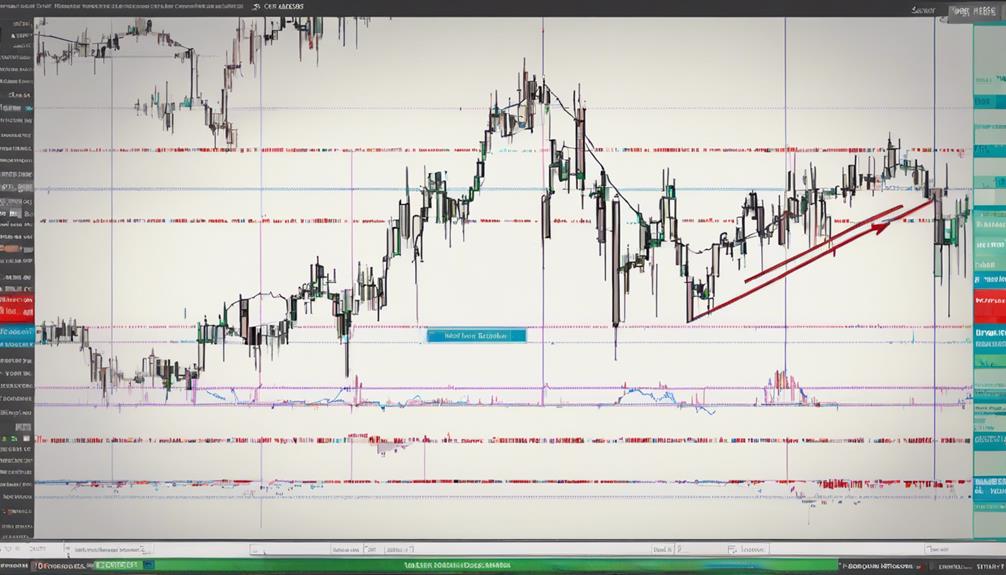
How can the CCI indicator be effectively utilized to identify trend reversals in market dynamics? The Commodity Channel Index (CCI) proves valuable in detecting potential trend reversals through specific signal thresholds. When the CCI crosses above +100, it suggests a potential uptrend reversal, while a move below -100 indicates a potential downtrend reversal. Additionally, divergence between price movements and CCI readings can signal weakening trends and potential reversals. Extreme CCI readings above +200 or below -200 provide stronger confirmation of trend reversals. Traders often combine CCI with other indicators like moving averages and RSI to validate reversal signals effectively. By interpreting CCI signals for trend reversals, traders can anticipate market shifts and make informed decisions in their trading strategies.
| CCI Signal | Interpretation | Potential Action |
|---|---|---|
| CCI > +100 | Potential uptrend reversal | Consider buying |
| CCI < -100 | Potential downtrend reversal | Consider selling |
| Divergence | Price-CII mismatch indicating weakening trend | Prepare for reversal |
| CCI > +200 or < -200 | Strong confirmation of trend reversal | Confirm trading decision |
Using CCI for Trend Identification
Utilizing the CCI indicator for trend identification involves assessing price deviations from the historical average to gauge trend strength. The CCI helps traders pinpoint potential trends in the market by analyzing the relationship between CCI readings and price movements.
Here are some key points to ponder when using CCI for trend identification:
- CCI readings above +100 or below -100 indicate strong trend strength.
- Divergence between CCI and price movements can signal potential trend reversals.
- Combining CCI with other indicators like moving averages enhances trend identification accuracy.
- CCI is used to confirm trends and determine entry and exit points based on trend strength.
- Understanding CCI in conjunction with trend channels and commodity market dynamics can provide valuable insights into trend identification processes.
Implementing CCI Trading Strategies
Implementing CCI trading strategies involves utilizing entry signals generated by the CCI indicator.
Strategically setting stop-loss orders to manage risk is another crucial aspect.
Efficiently exiting trades based on CCI readings is essential for successful trading.
By incorporating these key points into a trading plan, investors can enhance their decision-making process and potentially improve trading outcomes.
Analyzing CCI signals alongside other technical indicators can provide a more thorough understanding of market dynamics and assist in making informed trading choices.
Entry Signals Using CCI
Exploring the strategic utilization of CCI entry signals in trading scenarios offers investors a valuable tool for identifying potential buying opportunities.
When implementing CCI trading strategies, traders look for extreme readings above +100 as entry points in an uptrend. Confirmation of CCI entry signals can be strengthened by observing bullish candlestick patterns and RSI divergence.
Proper risk management techniques are essential to mitigate potential losses when acting on these signals. Ultimately, CCI entry signals assist traders in capturing profits by entering positions at ideal points in the market.
Setting Stop-Loss Orders
Incorporating stop-loss orders is a crucial aspect of effectively executing CCI trading strategies to manage risk in volatile market conditions. By setting stop-loss levels based on CCI signals and recent price action, traders can safeguard their capital and minimize losses.
It is vital to place stop-loss orders at strategic levels to guarantee trade protection and adjust them as the market moves. This approach allows traders to lock in profits or limit potential losses in line with CCI analysis.
Implementing stop-loss orders not only helps in managing risk but also aids in maintaining discipline and avoiding emotional decision-making during trades. Strategic use of stop-loss orders based on CCI signals is key to successful trading.
Exiting Trades With CCI
Utilizing the CCI indicator to identify potential reversal signals is essential when determining the best timing to exit trades in CCI trading strategies. When looking to exit trades with CCI, traders should consider the following:
- Look for CCI crossing back below +100 as a signal to exit a long trade.
- Consider exiting a short trade when CCI crosses back above -100.
- Combine CCI exit signals with other confirming indicators for improved accuracy.
- Implement proper risk management by setting stop-loss levels based on CCI signals when exiting trades.
Avoiding Common CCI Mistakes
To master the CCI indicator effectively, it is important to understand and avoid common mistakes that traders often encounter. Avoid relying solely on its signals for trading decisions as this could lead to potential losses. It is vital to confirm CCI signals by cross-referencing them with other technical indicators or chart patterns to increase accuracy.
Traders should be cautious of overreliance on the CCI indicator and consider using additional tools for validation to avoid false signals. By incorporating complementary indicators to filter out these false signals, traders can maximize the effectiveness of the CCI indicator.
Learning from common mistakes and pitfalls associated with the CCI indicator is key to refining trading strategies and enhancing overall performance in the market. By being mindful of these factors, traders can improve their decision-making processes and achieve better results when utilizing the CCI indicator in their trading activities.
Combining CCI With Other Indicators
Integrating the Commodity Channel Index (CCI) with indicators like the Moving Average Convergence Divergence (MACD), Relative Strength Index (RSI), and Stochastic oscillator can offer traders a thorough view of market dynamics. By combining CCI with these indicators, traders can gain insights into both momentum and overbought/oversold conditions, enhancing their decision-making process.
This strategic amalgamation allows for a more detailed analysis, enabling traders to potentially improve their trading outcomes by leveraging multiple indicators simultaneously.
CCI With MACD
When combining the Commodity Channel Index (CCI) with the Moving Average Convergence Divergence (MACD), traders can enhance their ability to confirm market trends and anticipate potential reversals.
MACD is a trend-following momentum indicator that complements CCI's overbought and oversold signals.
Using CCI and MACD together enhances the accuracy of trading signals.
CCI's identification of overbought or oversold conditions can be validated by MACD crossovers.
Integrating CCI with MACD offers a thorough approach to analyzing market trends and making informed trading decisions.
CCI With RSI
Combining the Commodity Channel Index (CCI) with the Relative Strength Index (RSI) enhances trading signals by confirming overbought or oversold conditions. RSI helps validate CCI signals by identifying extreme price levels for potential trend reversals. Using CCI and RSI together provides a thorough approach to analyzing market conditions and making informed trading decisions. CCI and RSI crossovers can indicate strong buying or selling opportunities when aligned with other technical indicators. Integrating CCI with RSI allows traders to identify high-probability trade setups and manage risk effectively.
| CCI With RSI | |
|---|---|
| Enhances Signals | Confirms Overbought/Oversold |
| Validates CCI signals | Identifies Extreme Price Levels |
| Thorough Analysis | Informed Trading Decisions |
| Crossovers Indicate Opportunities | Align with Other Indicators |
| High-Probability Setups | Effective Risk Management |
CCI With Stochastic
Enhancing trading signals through the correlation of the Commodity Channel Index (CCI) with the Stochastic indicator offers valuable insights into market dynamics and potential trading opportunities. When combined, these indicators can be powerful tools for traders.
Here are some key points to keep in mind when utilizing CCI with Stochastic:
- Look for cross signals between CCI and Stochastic for potential trading opportunities.
- Stochastic helps confirm CCI signals by identifying overbought and oversold conditions.
- Use CCI to spot trend reversals and Stochastic to validate entry and exit points.
- Integrating both indicators can enhance trading decisions by providing complementary insights.
- The combination of CCI and Stochastic can improve the accuracy of identifying price extremes and trend changes.
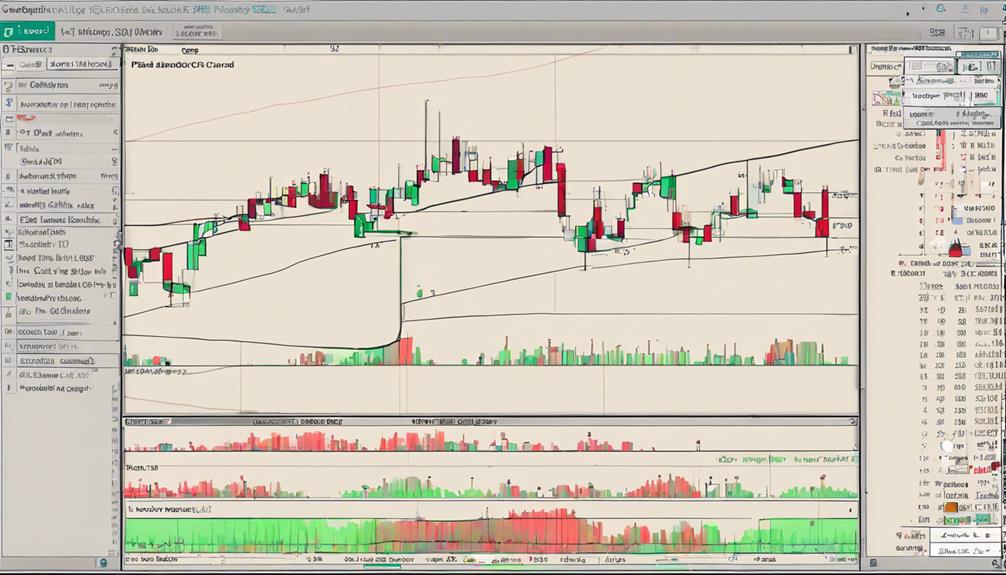
Setting Up CCI on Trading Platforms
To efficiently set up the CCI indicator on trading platforms, select a reputable platform that includes the CCI indicator for technical analysis. When using the CCI indicator, it is important to have the option to adjust settings based on your trading strategy. Look for platforms that offer customization features to tailor the CCI parameters to your specific needs.
Additionally, make sure that the platform provides reliable data feeds to guarantee accurate CCI calculations. Setting up the CCI indicator correctly is vital for its effective utilization in trading decisions. Follow the step-by-step guide provided within the platform to set up the indicator accurately.
Backtesting historical data on the platform can also help you understand how the CCI indicator performs in various market conditions. By selecting a platform that supports the CCI indicator and offers customization options with reliable data feeds, you can enhance your technical analysis capabilities and make informed trading decisions based on CCI signals.
Identifying Overbought/Oversold Levels
After setting up the CCI indicator on your chosen trading platform, the identification of overbought and oversold levels becomes crucial for making strategic trading decisions based on CCI readings. The CCI helps traders determine potential buying or selling opportunities by recognizing these levels.
Here are key points to keep in mind:
- CCI identifies overbought conditions when readings are above +100.
- Oversold levels are indicated when CCI readings fall below -100.
- Extreme CCI values above +200 or below -200 signal strong overbought or oversold conditions.
- Crossing the +100 level suggests potential buying opportunities.
- Crossing the -100 level suggests potential selling opportunities.
Real-life CCI Trading Examples
Utilizing real-life scenarios, the application of the CCI indicator in trading exemplifies its effectiveness in identifying potential market opportunities.
For instance, when the CCI crosses above +100 in an uptrend, it often signals buying opportunities. These signals, when confirmed by bullish candlestick patterns and RSI divergence, offer strong indications for traders to enter the market.
However, successful trading goes beyond mere signal recognition; proper risk management strategies play an essential role. Real-life examples have shown that combining CCI signals with other technical indicators not only enhances trading decisions but also helps in capturing substantial profits.
Additionally, these examples highlight how the CCI can effectively pinpoint trend changes, allowing traders to adjust their positions accordingly. By observing these real-life instances and understanding the significance of risk management alongside technical analysis, traders can maximize the potential of the CCI indicator in their trading strategies.
Timing Entry and Exit Points
When considering the timing of entry and exit points in trading with the CCI indicator, what key factors should be prioritized for effective decision-making? Timing entry points with the CCI involves looking for when the indicator crosses above +100 for potential buying opportunities. Exiting trades can be timed when the CCI crosses below -100, signaling potential selling points. Utilize extreme CCI readings above +200 or below -200 for stronger confirmation of entry and exit points. Consider combining CCI signals with other technical indicators or chart patterns to enhance timing accuracy. Setting stop-loss levels based on CCI signals is essential to effectively manage risk when timing entry and exit points.
- Identify CCI crosses above +100 for potential buying opportunities
- Time exits when CCI crosses below -100 for selling opportunities
- Use extreme CCI readings above +200 or below -200 for confirmation
- Combine CCI signals with other indicators for precision
- Set stop-loss levels based on CCI signals to manage risk
Risk Management With CCI

Incorporating effective risk management strategies with the CCI indicator is paramount for guaranteeing sound decision-making and optimizing trading outcomes. When utilizing the CCI indicator, it is essential to set appropriate stop-loss and take-profit levels based on the signals provided. Maintaining proper risk-reward ratios will help in balancing potential gains and losses. Historical backtesting with the CCI can offer valuable insights into past performance and aid in refining risk management techniques. Integrating CCI readings into an overall risk management plan enhances the quality of trading decisions. Emphasizing disciplined trading practices is essential while using the CCI to prevent emotional decision-making.
| Risk Management Strategies | Description | Benefits |
|---|---|---|
| Stop-loss | Set to limit potential losses | Protects capital in adverse scenarios |
| Take-profit | Defines profit-taking levels | Locks in gains at favorable points |
| Risk-reward Ratios | Balances risk and reward | Ensures a favorable risk-return tradeoff |
Enhancing CCI Profitability
Enhancing profitability with the CCI indicator can be achieved by integrating it with complementary technical analysis tools to validate trading decisions and improve overall accuracy. When looking to enhance CCI profitability, traders can consider the following strategies:
- Utilize moving averages: Combine CCI with moving averages to confirm trend directions and increase trading decision precision.
- Incorporate support and resistance levels: Use CCI alongside support and resistance levels to identify ideal entry and exit points for trades.
- Implement risk management techniques: Emphasize risk management strategies while using CCI signals to maintain control over outcomes and improve profitability.
- Conduct backtesting of CCI strategies: Evaluate performance through backtesting to refine approaches, enhance profitability, and adapt to market conditions.
- Engage in continuous learning: Stay updated on CCI applications, trends, and market changes to maximize profitability and refine trading strategies effectively.
Validating CCI Signals
Validating CCI signals requires a comprehensive approach that involves cross-referencing with other technical indicators and analyzing chart patterns for enhanced reliability in trading decisions.
By confirming CCI signals with indicators such as RSI, MACD, or moving averages, traders can strengthen their buy or sell signals. Looking for convergence of signals from multiple indicators can further boost the confidence in CCI signals.
Incorporating chart patterns and conducting price action analysis is vital to filter out false trading signals that the Commodity Channel Index might generate. Additionally, combining volume analysis with CCI signals can help confirm the strength of a potential trend change indicated by the CCI.
It is essential to remember that trading solely based on CCI signals may not be advisable; seeking confirmation from complementary indicators or market conditions is prudent to make well-informed trading decisions.
Mastering CCI for Day Trading
When mastering CCI for day trading, utilizing shorter timeframes such as 5 or 15 minutes can provide day traders with valuable insights into short-term market conditions for optimizing entry and exit strategies.
Here are some key points to bear in mind when using CCI for day trading:
- CCI helps identify overbought and oversold conditions in the short term.
- Setting precise entry and exit points based on CCI signals is essential for day trading strategies.
- Implementing tight stop-loss orders is vital to manage risk effectively.
- Combining CCI signals with other short-term indicators like the Stochastic Oscillator can enhance trading decisions.
- Scalping strategies benefit from CCI by focusing on quick price movements and seizing rapid profit-taking opportunities.
Frequently Asked Questions
What Is the Best Strategy for CCI Trading?
The best strategy for CCI trading involves utilizing extreme CCI readings above +100 or below -100 as entry and exit points. Proper risk management techniques, such as setting stop-loss levels based on CCI signals, are essential to protect profits.
Identifying divergences between price and CCI aids in trend identification and decision-making. Additionally, backtesting the strategy and adjusting for market volatility through position sizing are vital for optimizing profit targets and overall performance.
How to Understand CCI Indicator?
The CCI indicator is understood through its calculation based on measuring the deviation of the current price from its historical average. It helps identify overbought conditions when readings are above +100 and oversold conditions when below -100.
Traders use CCI for trend identification, recognizing divergence patterns, determining position sizing, and setting stop loss placements. Understanding these aspects of the CCI indicator aids traders in making informed trading decisions across various markets.
What Is the Success Rate of the CCI Indicator?
The success rate of the CCI indicator can vary based on factors such as backtesting results, real-time analysis, historical data, market conditions, risk management, entry signals, and exit strategies.
Traders need to analyze the effectiveness of the CCI indicator through rigorous testing in different scenarios to gauge its reliability.
What Is the Best Time Frame for CCI Indicator?
When deciding on the best time frame for the CCI indicator, traders must consider their trading style and objectives. Short-term traders, such as scalpers or intraday traders, may benefit from shorter time frames like 14 periods for more sensitive signals.
On the other hand, swing traders aiming to capture larger trends might find longer time frames like 30 periods more suitable for trend identification and volatility analysis. Adapting the time frame to one's strategy can enhance risk management and overall trading effectiveness.
Conclusion
To sum up, mastering the CCI indicator is essential for successful trading. By understanding its calculation method, interpreting signals, identifying trends, and implementing strategies, traders can effectively manage risk and enhance profitability.
Validating signals and applying CCI for day trading can further improve trading outcomes. Remember, in the world of trading, knowledge of the CCI indicator is like a compass guiding you through the turbulent seas of the market.