
Mastering MACD in technical analysis involves grasping its basics, interpreting signals accurately, utilizing effective trading techniques, and confirming trends and momentum shifts. With a solid understanding of MACD's intricacies, traders can identify buy/sell signals through crossovers and divergence patterns, analyze market momentum via the histogram, and enhance trend confirmation. By combining MACD with other indicators, traders refine their strategies and adapt to diverse market conditions. The step-by-step guide provides insight into utilizing MACD effectively for successful technical analysis. Understanding these nuances will enhance your trading decisions and market analysis capabilities.
Understanding MACD Indicator Basics
In delving into the domain of technical analysis, a foundational understanding of the MACD indicator basics is indispensable for traders and investors seeking to navigate the complexities of the financial markets effectively.
The MACD, short for Moving Average Convergence Divergence, was developed by Gerald Appel in the 1970s. It comprises the MACD line, calculated as the 12-day Exponential Moving Average (EMA) minus the 26-day EMA, the signal line, which represents the 9-day EMA of the MACD line, and the histogram, illustrating the difference between the MACD and signal lines.
This indicator serves various purposes, such as identifying buy and sell signals, confirming trend reversals, and measuring momentum in the market. To utilize the MACD effectively, traders must grasp its basics, including how the lines are calculated and the significance of crossovers. Moreover, proper parameter settings, selecting the appropriate timeframe, and combining the MACD with other indicators can enhance its utility in technical analysis strategies.
Interpreting MACD Signals
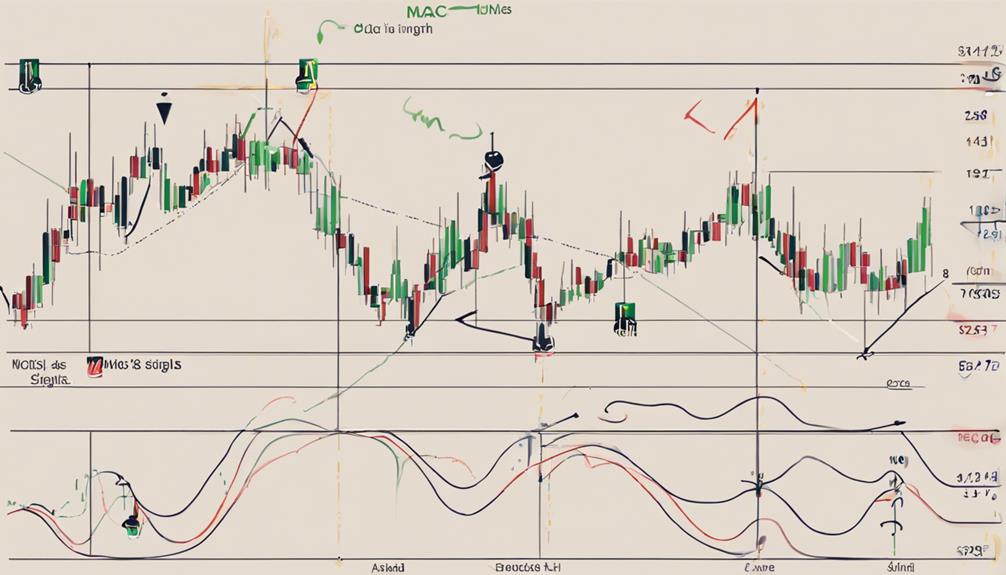
Interpreting MACD signals involves analyzing critical points such as:
- Signal line crossovers indicate potential shifts in market trends.
- Divergence patterns highlight discrepancies between price movements and MACD indicators.
- Histogram analysis provides insights into the strength and momentum of a trend.
These key points enable traders to make well-informed decisions based on the analysis of MACD signals.
Signal Line Crossovers
Signal line crossovers play a pivotal role in determining market sentiment and potential trading opportunities when analyzing MACD signals. When the MACD line crosses above the signal line, it generates a bullish signal, indicating a potential uptrend. Conversely, a bearish signal is triggered when the MACD line crosses below the signal line, suggesting a possible downtrend. These crossovers help traders identify potential trend changes and entry/exit points, making them essential for accurately interpreting MACD signals. Below is a table summarizing the key points about signal line crossovers:
| Aspect | Description |
|---|---|
| Definition | MACD line crossing the signal line |
| Bullish Signal | MACD line above signal line |
| Bearish Signal | MACD line below signal line |
| Importance | Identifying trend changes and entry/exit points |
Divergence Patterns
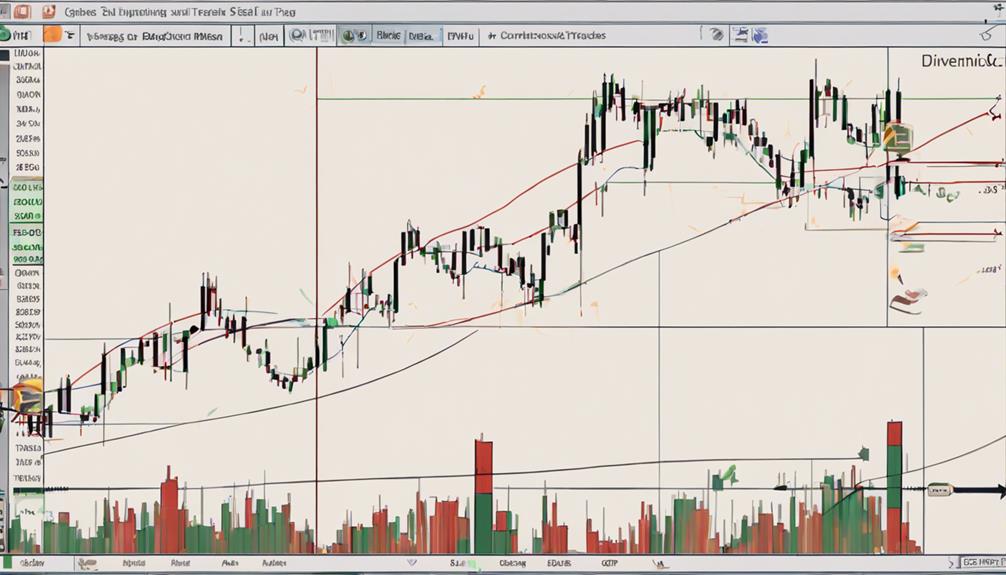
Divergence patterns in MACD analysis serve as important indicators for anticipating market shifts and potential trading opportunities. Bullish divergence, characterized by price moving to new lows while MACD forms higher lows, suggests a potential price increase.
Conversely, bearish divergence, where price forms higher highs as MACD creates lower highs, indicates a potential price drop. Regular divergence compares price highs or lows with MACD peaks or troughs, while hidden divergence contrasts price and MACD highs or lows.
These patterns assist traders in identifying possible trend reversals or continuations in the market. By understanding and interpreting MACD divergence signals, traders can gain valuable insights to make informed trading decisions.
Histogram Analysis
When analyzing MACD signals, delving into the histogram provides traders with a visual representation of the difference between the MACD line and the signal line, offering valuable insights into market momentum and potential shifts in sentiment.
The histogram's bars indicate bullish momentum when positive and bearish momentum when negative. The height of the bars reflects the strength of the momentum in the corresponding direction. Crosses above or below the zero line on the histogram signal changes in market sentiment.
MACD Trading Techniques
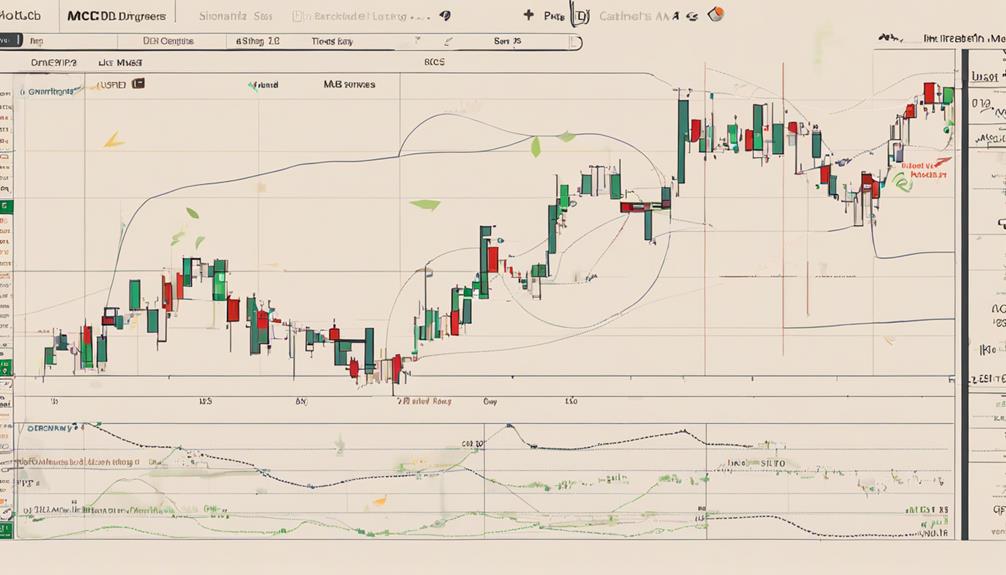
Utilizing MACD in trading strategies involves implementing various techniques to capitalize on momentum shifts and trend reversals in the market. Traders often rely on the MACD Crossover Strategy, where buying occurs when the MACD line crosses above the Signal Line and selling takes place when it crosses below. Another popular approach is the MACD Divergence Strategy, which identifies inconsistencies between the MACD Line and price movements to predict potential trend reversals. Additionally, the MACD Histogram Strategy analyzes momentum shifts by evaluating the bars' heights and direction. To enhance trading signals, combining MACD with other indicators such as the Relative Strength Index (RSI) or moving averages is common practice. Moreover, adjusting MACD parameters like the lengths of the Exponential Moving Averages (EMA) or signal line periods can help traders adapt to varying market conditions.
| MACD Strategy | Description | Example |
|---|---|---|
| Crossover Strategy | Buying when MACD line crosses above Signal Line, selling when it crosses below. | Buy signal at point A. |
| Divergence Strategy | Identifying discrepancies between MACD Line and price movements for trend reversals. | Divergence at point B. |
| Histogram Strategy | Analyzing momentum shifts based on the bars' heights and direction. | Histogram peak at point C. |
Effective MACD Strategies
Building on the foundational concepts of MACD trading techniques, an exploration of effective MACD strategies reveals nuanced approaches to capitalize on market dynamics and enhance trading outcomes.
The MACD crossover strategy involves executing buy orders when the MACD line surpasses the signal line and selling positions when the MACD line falls below the signal line.
On the other hand, the MACD histogram strategy focuses on interpreting the height of the bars to identify shifts in market momentum, providing valuable insights into potential buying or selling opportunities.
Additionally, the MACD divergence strategy scrutinizes inconsistencies between the MACD line and price movements to forecast potential trend reversals, offering traders a means to anticipate market shifts.
By combining MACD with other indicators such as RSI or Bollinger Bands, traders can strengthen signal confirmation and refine their trading decisions.
It is advisable to practice these strategies on a demo account across various timeframes to gauge their effectiveness before applying them in live trading scenarios.
Leveraging MACD for Trend Confirmation
When utilizing MACD for trend confirmation, traders can effectively analyze the relationship between the MACD line and the signal line to make informed decisions on market trends. The MACD line and signal line interaction provide valuable insights into potential trend reversals and strength. Here are key points to ponder when using MACD for trend confirmation:
- Positive MACD histogram bars indicate bullish trend confirmation, while negative bars suggest a bearish trend.
- Employing MACD for trend confirmation helps traders make informed decisions on entry and exit points.
- Monitoring the convergence or divergence between the MACD line and signal line enhances trend confirmation accuracy.
- MACD's ability to confirm trends makes it a valuable tool for technical analysis in trading strategies.
Using MACD for Momentum Analysis
When utilizing MACD for momentum analysis, traders focus on two key aspects: trend identification and interpreting the MACD Histogram.
By analyzing the MACD Line's relationship with the Signal Line, investors can pinpoint shifts in momentum strength.
Additionally, the MACD Histogram provides a visual representation of momentum changes, aiding traders in making informed decisions based on the indicator's readings.
MACD for Trend Identification
Utilizing the MACD indicator for trend identification involves deciphering momentum dynamics through the comparison of moving averages. Traders can effectively analyze trends by observing the relationship between the MACD line and the signal line.
Here are key points to keep in mind when using MACD for trend identification:
- Positive MACD values signal bullish momentum.
- Negative MACD values indicate bearish momentum.
- Crossovers between the MACD line and the signal line confirm trend direction.
- The histogram bars in the MACD display the strength and direction of momentum.
Interpreting MACD Histogram
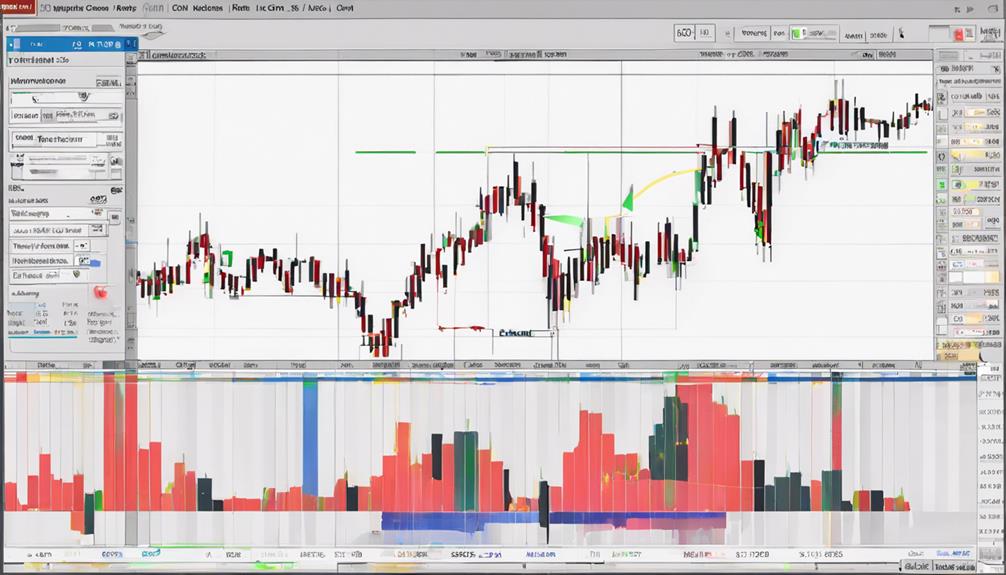
Observing the MACD Histogram provides traders with a detailed insight into momentum dynamics, essential for analyzing market trends effectively. The histogram, derived from the variance between the MACD Line and the Signal Line, serves as a key indicator for identifying shifts in bullish or bearish momentum.
Positive histogram bars signal bullish momentum, indicating a strengthening trend, while negative bars suggest bearish momentum and a potential trend reversal. Traders closely monitor the direction and magnitude of histogram bars; a rising histogram supports the prevailing trend, while a declining histogram may indicate weakening momentum.
Additionally, crossovers of the histogram with the zero line offer valuable early signals of potential trend changes, aiding traders in making informed decisions in the dynamic financial markets.
Avoiding MACD Pitfalls
To navigate the complexities of utilizing the MACD indicator effectively, it is essential to steer clear of the common pitfalls that may hinder your trading decisions and overall strategy. When incorporating MACD into your technical analysis, consider the following to avoid potential setbacks:
- Avoid relying solely on MACD signals for trading decisions, as it is not a foolproof predictor of market movements.
- Use MACD in conjunction with other technical indicators to confirm signals and minimize false positives.
- Be mindful of market conditions and adapt MACD parameters accordingly to avoid misinterpretations.
- Regularly review and refine your MACD strategy to stay ahead of changing market dynamics and trends.
MACD in Buy and Sell Signals
Exploring the intricacies of MACD analysis, a key focus lies in understanding the significance of MACD in generating buy and sell signals within trading strategies. Buy signals are typically generated when the MACD line crosses above the signal line, indicating a potential uptrend in the market. Conversely, sell signals are triggered when the MACD line crosses below the signal line, suggesting a possible downtrend.
The histogram bars in MACD play a vital role in providing visual cues about the momentum direction, aiding traders in making informed buy or sell decisions. By analyzing the relationship between the MACD line, signal line, and histogram bars, traders can pinpoint potential entry and exit points with greater precision.
Mastering the interpretation of MACD buy and sell signals is essential for traders looking to develop effective trading strategies and capitalize on market movements efficiently. By leveraging these signals, traders can enhance their decision-making process and improve the overall performance of their trading endeavors.
Incorporating MACD in Trading
Incorporating MACD into trading strategies enhances market analysis and decision-making by providing insights into trend reversals and confirming trend strength. Traders can benefit from utilizing MACD in various ways:
- Combining with Other Indicators: Integrating MACD with indicators like the Exponential Moving Average (EMA) can offer more thorough signals for informed trading decisions.
- Analyzing MACD Histogram: Monitoring the MACD histogram can help traders identify potential trend changes based on the difference between the MACD line and the signal line.
- Understanding Crossovers and Divergences: Being proficient in recognizing MACD crossovers and divergences is essential for interpreting market movements accurately.
- Utilizing Different Timeframes: Adapting MACD analysis to different timeframes allows traders to filter out false signals and enhance the accuracy of their trading strategies.
Mastering MACD for Success
Mastering MACD for success involves a deep understanding of MACD basics and the ability to accurately interpret MACD signals.
By grasping the fundamentals and nuances of MACD, traders can effectively identify trends and make informed decisions.
Utilizing MACD in this manner can greatly enhance trading strategies and contribute to achieving successful outcomes in the market.
MACD Basics Explained
Understanding the fundamental components of MACD is essential for effectively analyzing market trends and momentum.
- MACD: Stands for Moving Average Convergence Divergence, developed by Gerald Appel.
- MACD Line: Calculated by subtracting the 26-period EMA from the 12-period EMA.
- Signal Line: Helps identify potential buy or sell signals.
- Histogram: Confirms trend strength by showing the difference between the MACD line and the signal line.
Interpreting MACD Signals
How can investors effectively leverage MACD signals to enhance their trading strategies and achieve success in the financial markets? Understanding MACD signals is essential for making informed trading decisions.
A bullish signal occurs when the MACD line is above the signal line, indicating potential buying opportunities. Conversely, a bearish signal is present when the MACD line falls below the signal line, suggesting a possible downturn.
The histogram bars within the MACD provide insight into the momentum of the market, showing the strength of the current trend. By combining these signals with other technical indicators, traders can gain confirmation and refine their trading strategies.
Utilizing the MACD line, signal line, and histogram bars effectively can lead to improved trading outcomes.
Frequently Asked Questions
How to Master Macd Indicator?
To master the MACD indicator, one must focus on MACD interpretation techniques, signal confirmation, and divergence analysis. Understanding how to interpret the MACD line, signal line, and histogram bars is essential.
Confirming signals by observing the relationship between the MACD line and signal line enhances accuracy. Additionally, analyzing MACD divergences where price movement contradicts MACD movement can provide valuable insights for decision-making in technical analysis.
Practice and experience are key to mastering the MACD indicator effectively.
What Does 12 26 9 Mean on Macd?
The numbers 12, 26, 9 on MACD refer to the default parameters used in the calculation and interpretation of the indicator.
The 12 and 26 represent the respective periods for the Exponential Moving Averages (EMAs) used in the MACD calculation, while the 9 is the period for the EMA of the MACD Line, known as the Signal Line.
These values impact the sensitivity and responsiveness of the MACD indicator to price movements, aiding in understanding MACD signals and interpreting the MACD histogram.
What Is the MACD 5 Minute Strategy?
The MACD 5-minute strategy is a trading approach that leverages the MACD indicator on a 5-minute chart to pinpoint short-term trend identification.
Traders utilize this strategy to capture quick buying and selling opportunities within the 5-minute timeframe, relying on the MACD for entry and exit signals in the fast-moving market.
Effective risk management is vital in implementing the MACD 5-minute strategy to optimize trading outcomes and navigate volatile intraday trends.
What Is the Best Setup for Macd?
The ideal parameters for the MACD setup typically involve using default values of 12, 26, 9 for the EMA periods. However, effective strategies may involve customizing these settings to suit different trading styles and market conditions.
Advanced techniques often include experimenting with various EMA combinations to enhance MACD signals. Traders should consider factors like asset class, volatility, and desired trading strategy when determining the best MACD setup for their individual preferences.
Conclusion
To sum up, mastering the MACD indicator is essential for successful technical analysis in trading. Despite its complexities, understanding the basics, interpreting signals, and applying effective strategies can lead to profitable outcomes.
However, it is important to remember that even with thorough knowledge and utilization of MACD, there is always an element of unpredictability in the market. Ultimately, mastering MACD does not guarantee absolute success, but rather provides a valuable tool in maneuvering the volatile world of trading.