
Mastering candlestick charts for day trading involves understanding components like body, shadows, and sentiment analysis. Candlestick charts offer visual insights superior to bar charts for trend identification. Learning basic patterns like Doji and Hammer aids in spotting market reversals. Specific formations such as Bullish Engulfing offer entry signals with volume confirmation. Recognizing accurate patterns like Three White Soldiers requires historical backtesting. Analyzing consecutive candlestick patterns helps predict market movements effectively. By grasping these fundamentals, traders can make informed decisions for successful day trading. For deeper insights into mastering candlestick charts, explore the various candlestick rules and interpretations presented.
Candlestick Components
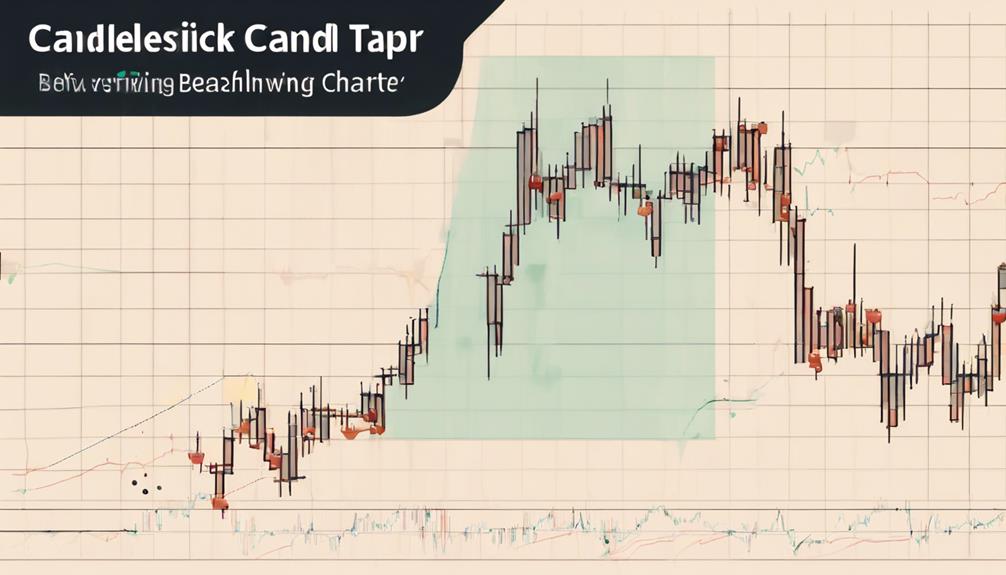
The fundamental elements of candlestick charts, known as candlestick components, play an essential role in conveying important information about price movements and market sentiment within a specified timeframe.
The body of a candlestick represents the opening and closing prices during a specific period, offering insights into the price action that occurred. The upper shadow indicates the highest price reached, while the lower shadow shows the lowest price traded.
The relationship between the body size and the length of the shadows provides valuable clues about market sentiment. A long body with short shadows suggests strong buying or selling pressure, indicating a potential continuation of the current trend. On the other hand, a small body with long shadows signifies indecision or a potential reversal in the market.
Understanding how these components interact is essential for interpreting candlestick charts accurately and making informed trading decisions based on the observed patterns.
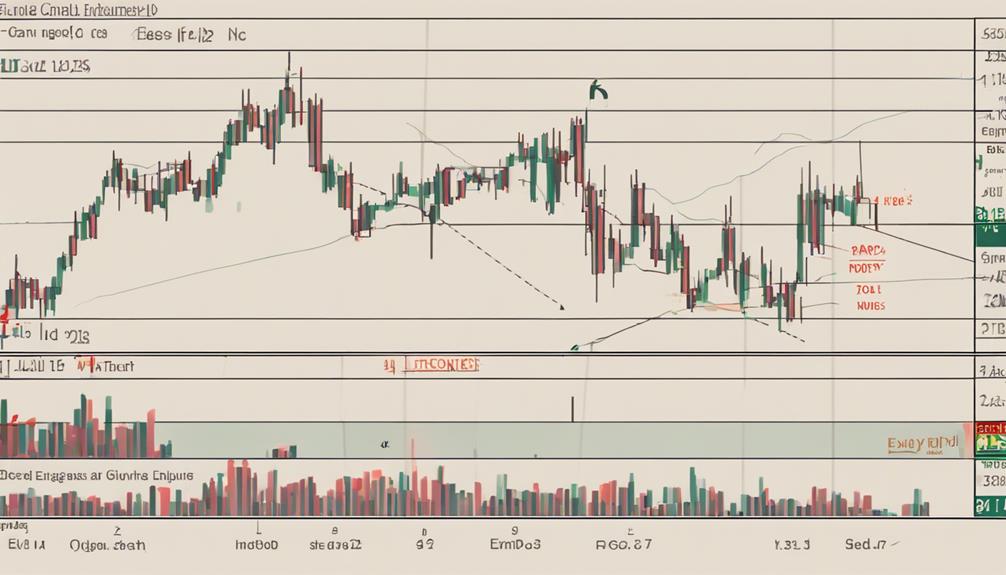
Candlestick Vs. Bar Charts
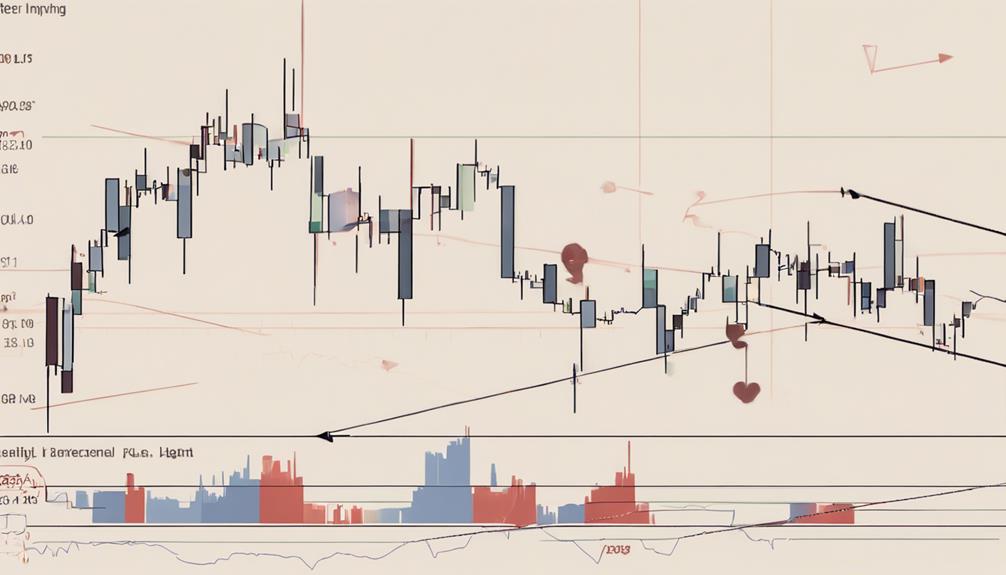
Comparing candlestick charts to bar charts reveals distinct visual representations of price data in financial analysis. Candlestick charts display price movements with open, high, low, and close prices in a visually appealing and easy-to-interpret format. In contrast, bar charts represent price data using horizontal lines for open and close prices and vertical lines for high and low prices, lacking the color-coded real bodies and shadows that provide valuable information in candlestick charts.
Candlestick charts offer traders a quick visual analysis of price trends and market sentiment due to their ability to highlight price differences and patterns effectively. This visual impact makes candlestick charts preferred by many traders over bar charts for day trading and technical analysis. The clear depiction of price movements and market psychology through candlestick charts enhances traders' ability to make informed decisions based on historical price trends and patterns, improving their overall trading strategies.
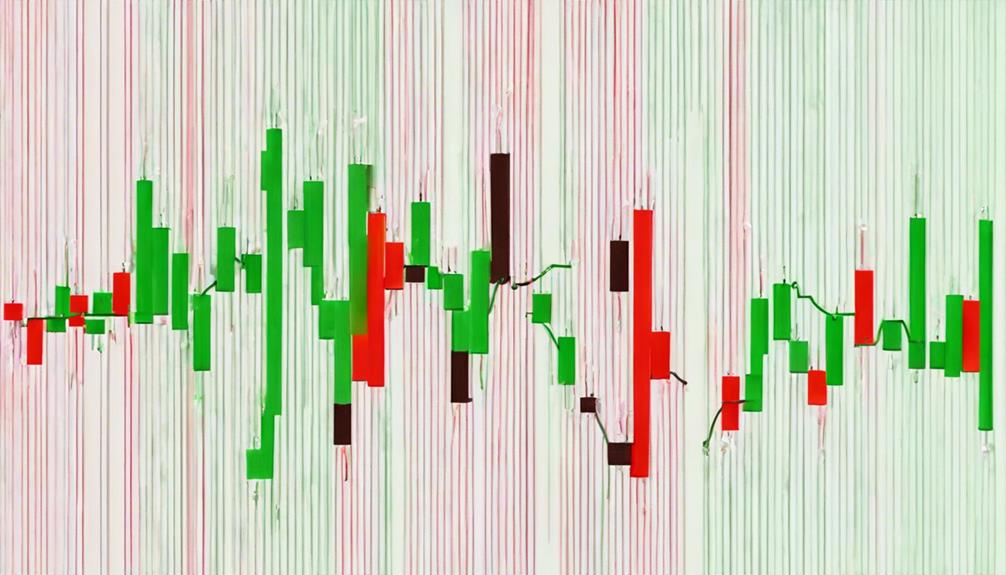
Basic Candlestick Patterns
Basic Candlestick Patterns are fundamental tools in technical analysis for day trading. These patterns, such as Doji, Hammer, and Engulfing, provide valuable insights into market sentiment and potential price movements.
Recognizing and interpreting these patterns can assist traders in making informed decisions regarding trend reversals and continuations.
Common Candlestick Formations
Finally, exploring the significance of common candlestick formations provides day traders with valuable insights into potential market trends and reversals.
The bullish engulfing pattern, characterized by a small red candle followed by a larger green candle, suggests a possible upward reversal.
On the other hand, the doji candlestick, with equal open and close prices, indicates market indecision and a potential trend change.
The hammer pattern, displaying a small body with a long lower shadow, signals a potential bullish reversal after a downtrend.
Conversely, the shooting star pattern, featuring a small real body with a long upper shadow, suggests a potential bearish reversal following an uptrend.
Ultimately, the morning star pattern, consisting of a long bearish candle, a small indecision candle, and a long bullish candle, hints at a potential bullish reversal.
Candlestick Pattern Recognition
Analyzing candlestick patterns provides day traders with essential insights into potential market movements and decision-making opportunities. When mastering candlestick pattern recognition for day trading, understanding basic patterns is fundamental. Here are some key points to keep in mind:
- Basic candlestick patterns like Doji, Hammer, and Engulfing offer signals for potential price reversals or continuations.
- These patterns help traders identify key entry and exit points in their day trading strategies.
- Doji candles indicate market indecision, while Hammer candles suggest potential bullish reversals, and Engulfing patterns hint at trend changes.
- Mastery of these basic patterns is vital for successful day trading and improving decision-making based on price action signals.
Interpreting Candlestick Chart Data
Understanding candlestick chart data, particularly basic patterns like Doji, Hammer, and Engulfing, is essential for interpreting market sentiment and anticipating potential price movements in day trading.
Bullish candlestick patterns such as Hammer and Morning Star suggest potential uptrends, while bearish patterns like Hanging Man and Evening Star indicate possible downtrends.
Reversal patterns like Piercing Line and Three Black Crows offer valuable insights into trend reversals and changes in market direction.
Recognizing these patterns through candlestick chart analysis enables traders to make informed decisions, identify entry and exit points, and stay ahead of market trends.
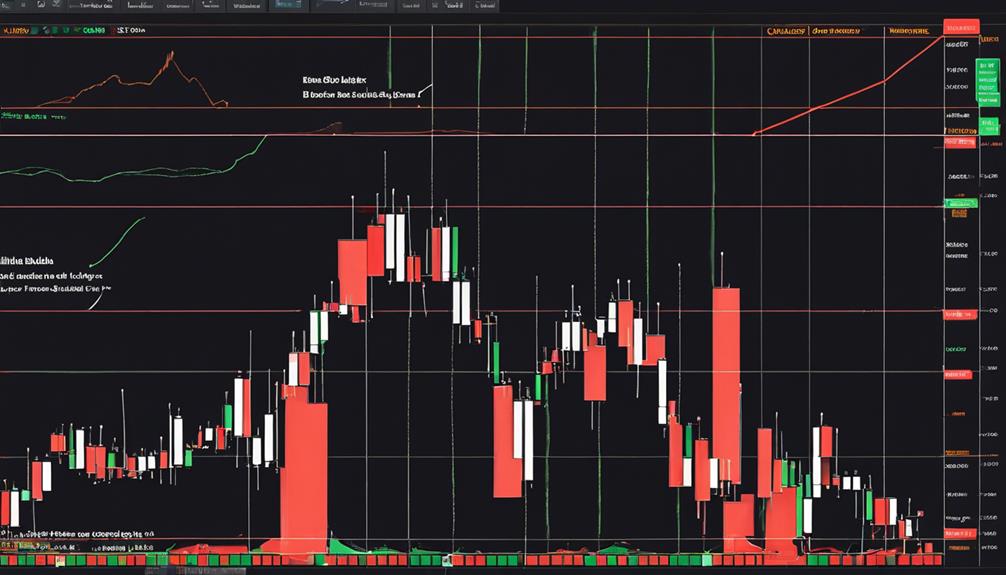
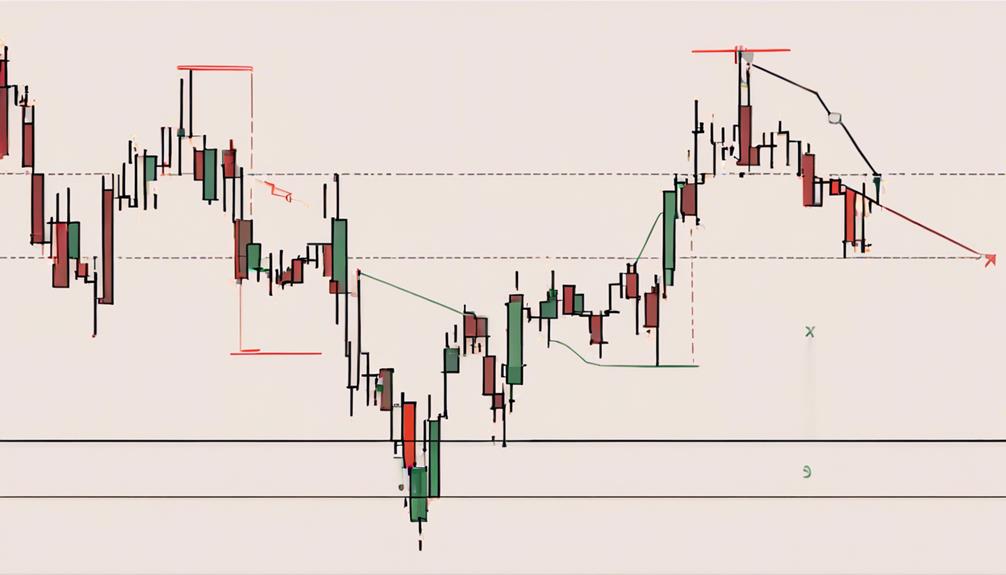
Bearish Engulfing Pattern
The Bearish Engulfing Pattern is a significant candlestick formation characterized by a bearish reversal signal. Traders pay attention to this pattern as it suggests a shift in market sentiment from bullish to bearish.
Understanding the definition, identification, and trading strategies related to the Bearish Engulfing Pattern is essential for making informed trading decisions.
Bearish Engulfing Definition
Marking a potential reversal in market sentiment, the Bearish Engulfing pattern signifies a significant shift in momentum through a distinct two-candlestick formation. Traders watch for this pattern at the end of an uptrend as it suggests a potential bearish reversal.
When analyzing the Bearish Engulfing pattern, it is crucial to keep in mind the following:
- Two-Candlestick Pattern: Comprising a large bearish candle that engulfs the prior smaller bullish candle.
- Shift in Momentum: Indicates a change from bullish sentiment to bearish sentiment.
- End of an Uptrend: Often observed as a signal for a potential downtrend.
- Trading Decisions: Confirmation through volume and technical indicators can help validate the pattern for making informed trading choices.
Identifying Bearish Engulfing
When observing price charts in day trading, recognizing the Bearish Engulfing pattern is essential for identifying potential shifts in market sentiment. The Bearish Engulfing pattern signals a reversal of an uptrend, indicating that selling pressure has surpassed buying pressure. This pattern is characterized by a larger bearish candlestick completely engulfing the previous smaller bullish candlestick. Traders often wait for confirmation signals such as a significant increase in trading volume and sustained selling activity after the pattern emerges. Understanding the Bearish Engulfing pattern on candlestick charts can empower traders to anticipate and potentially profit from a bearish market sentiment.
| Bearish Engulfing Pattern | Description | Importance |
|---|---|---|
| Reversal Signal | Indicates potential trend change | Identifying shifts |
| Selling Pressure | Bears overtaking bulls | Market control |
| Volume Increase | Confirmation signal | Strengthening pattern |
| Uptrend Reversal | Signifies potential downtrend | Market sentiment |
| Candlestick Charts | Tool for pattern recognition | Analyzing movements |
Trading Strategies for Bearish
Utilizing trading strategies tailored specifically for the Bearish Engulfing pattern can provide day traders with a structured approach to capitalize on potential market reversals. When trading bearish engulfing patterns, consider the following strategies:
- Entry Point: Look for the pattern at the end of an uptrend to signal a potential reversal in price direction.
- Confirmation Signals: Wait for increased volume and a close below the low of the engulfing candle to confirm the pattern's effectiveness.
- Risk Management: Set stop-loss orders to manage potential losses in case the market moves against your bearish position.
- Profit Target: Consider setting a profit target based on the size of the engulfing candle or by using other technical analysis tools to gauge potential price declines.
Bullish Engulfing Pattern
The Bullish Engulfing Pattern is a significant two-candle formation in candlestick chart analysis. It indicates a potential reversal from bearish to bullish market sentiment. This pattern is recognized by the second candle completely engulfing the body of the prior bearish candle.
Typically appearing at the culmination of a downtrend, the Bullish Engulfing Pattern serves as a signal for traders to contemplate entering a long or buying position, expecting the price to rise. To validate this pattern, traders often look for a surge in trading volume accompanying the formation, confirming the increased interest and participation in the market.
The first candle, usually small and bearish, is overtaken by a larger bullish candle in this pattern, emphasizing the shift towards bullish momentum. Recognizing and understanding the implications of the Bullish Engulfing Pattern can assist traders in making informed decisions regarding market entry and potential trend reversals.
Bearish Evening Star
The Bearish Evening Star pattern, comprising three distinct candles, serves as an important signal for potential trend reversals in day trading. When this pattern appears at the end of an uptrend, it indicates a shift from bullish to bearish sentiment in the market.
Here's how traders interpret and utilize this candlestick pattern:
- Three Candle Structure: The Bearish Evening Star consists of a large bullish candle, followed by a small-bodied candle or doji, and finalized with a large bearish candle.
- Trend Reversal Signal: It signifies weakening bullish momentum and the emergence of selling pressure, hinting at a possible trend reversal.
- Confirmation Signals: Traders seek validation through subsequent price action, such as lower closes after the Bearish Evening Star formation, to confirm the shift in trend.
- Interpretation in Day Trading: Context and placement of the pattern on the chart are vital factors for accurate interpretation and timely decision-making in day trading strategies.
Bearish Harami
A notable two-candle pattern in candlestick analysis for day trading, Bearish Harami indicates a potential shift from a bullish trend to a bearish one. This pattern consists of a bullish candle followed by a smaller bearish candle, where the body of the bearish candle is within the range of the previous bullish candle. It serves as a warning sign for traders that the uptrend may be losing momentum and could reverse its direction.
Bearish Harami suggests a change in market sentiment, especially when it emerges after a price increase. Traders often interpret this pattern as an opportunity to contemplate entering a short position, anticipating a downtrend. To confirm the signal provided by the Bearish Harami, traders typically employ additional technical analysis tools and take into account factors like trading volume and overall market conditions.
Understanding the context in which this pattern appears is essential for incorporating it effectively into day trading strategies, enhancing decision-making processes.
Bullish Harami
Portraying a potential shift in market sentiment, Bullish Harami is a two-candle pattern often indicative of a trend reversal from bearish to bullish. When analyzing this pattern, traders focus on specific characteristics and market conditions to determine its significance:
- Two-Candle Pattern: Bullish Harami consists of two candles where the second candle is smaller and within the range of the previous larger candle.
- Trend Reversal Signal: This pattern suggests a potential shift from a downtrend to an uptrend in the market, signaling a change in momentum.
- Confirmation Importance: Traders seek confirmation of the trend reversal by observing the price action following the Bullish Harami formation.
- Support Levels Significance: Bullish Harami is considered more reliable when it appears at key support levels or during periods of oversold conditions, reinforcing its potential impact on market direction.
Understanding the dynamics of the Bullish Harami pattern and its implications within the market context can assist traders in making informed decisions based on this bullish reversal signal.
Bearish Harami Cross
The Bearish Harami Cross pattern signifies a potential shift from a bullish trend to a bearish one.
It presents an opportunity for traders to anticipate a reversal in market momentum.
Understanding the implications and recognizing confirmation signals are essential for making informed trading decisions based on this candlestick pattern.
Candlestick Pattern Explanation
Within the domain of candlestick patterns, the Bearish Harami Cross signifies a significant shift in market sentiment from bullish to bearish. This pattern is vital for traders as it indicates a potential trend reversal and market indecision. Understanding the significance of this pattern involves analyzing the relationship between the small doji candle and the preceding bullish trend.
Key points to note about the Bearish Harami Cross include:
- Consists of a small doji candle inside a large bullish candle.
- Indicates potential trend reversal from bullish to bearish.
- Suggests indecision in the market followed by a possible shift in momentum.
- Traders seek confirmation signals to validate trading decisions post identification of the Bearish Harami Cross.
Trading Implications and Tips
Trading Implications and Tips for the Bearish Harami Cross pattern can provide valuable insights for day traders seeking to navigate potential trend reversals effectively. This candlestick pattern signifies market indecision following an uptrend, with the small bearish candle inside the previous bullish candle, hinting at a possible reversal. Traders often wait for confirmation signals such as a gap down or a lower close in the subsequent candle to validate the potential bearish reversal. The pattern holds more weight when identified at key resistance levels or after a prolonged uptrend, enhancing its predictive power. Understanding the Bearish Harami Cross pattern and its implications is important for day trading strategies aimed at capitalizing on potential downtrends.
| Candlestick Patterns | Bearish Harami Cross |
|---|---|
| Trend Reversal | Market Indecision |
| Confirmation Signals | Day Trading Strategies |
Bullish Harami Cross
Signaling a potential shift in market sentiment, the Bullish Harami Cross pattern in candlestick charts indicates a bullish reversal following a bearish trend. This pattern is characterized by a large bearish candle followed by a small bullish candle that has an opening and closing price within the previous candle's body. Here are some key points to keep in mind when identifying and interpreting the Bullish Harami Cross:
- Trend Reversal: The Bullish Harami Cross suggests a potential reversal from a bearish trend to a bullish one.
- Market Indecision: The appearance of a small bullish candle within the previous bearish candle signifies uncertainty or indecision in the market.
- Support Levels: This pattern is more reliable when it forms near key support levels, indicating a possible turning point in the price action.
- Confirmation: Traders often wait for additional price action to confirm the bullish reversal signaled by the Bullish Harami Cross before making trading decisions.
Understanding the significance of the Bullish Harami Cross pattern and its implications can assist traders in identifying potential opportunities for entering or exiting positions during day trading activities.
Bullish Rising Three
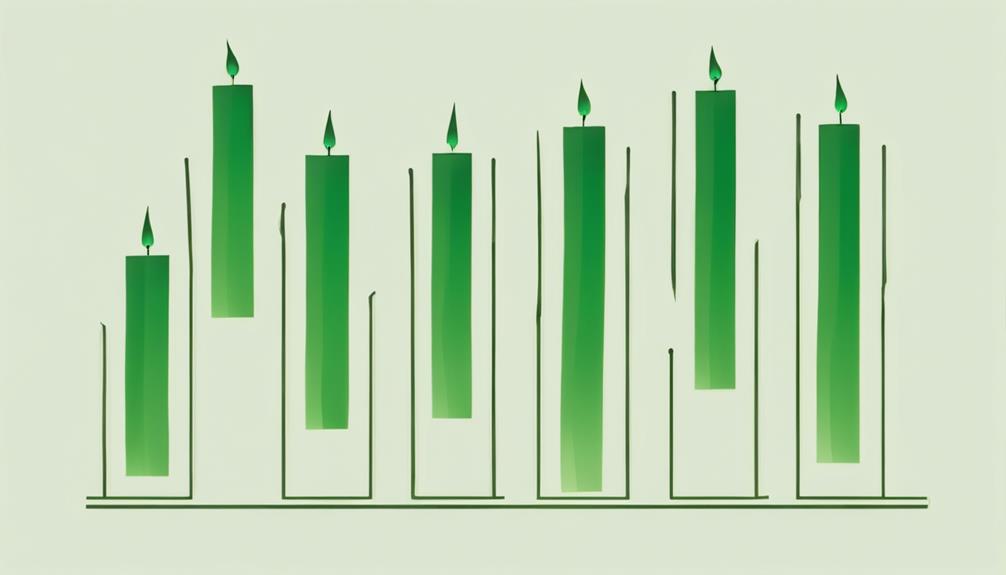
Demonstrating a robust bullish trend continuation, the Bullish Rising Three pattern in candlestick analysis showcases three consecutive long bullish candles with small real bodies. This pattern signifies a strong uptrend continuation, reflecting increasing buying pressure in the market and suggesting sustained bullish momentum. Traders often see this pattern as an opportunity to enter or add to their positions in anticipation of further price appreciation.
To further understand the dynamics of the Bullish Rising Three pattern, let's take a closer look at the characteristics of this formation:
| Feature | Description | Emotion |
|---|---|---|
| Three long bullish candles | Indicates strong buying interest | Optimism |
| Small real bodies | Shows minimal selling pressure | Confidence |
| Strong uptrend continuation | Validates bullish sentiment | Excitement |
Bearish Falling Three
Characterized by three consecutive long bearish candles with small real bodies and short shadows, the Bearish Falling Three pattern indicates a continuation of a bearish trend following an established downtrend. This pattern is vital for day traders looking to capitalize on bearish market movements.
Here are some key points to keep in mind when analyzing the Bearish Falling Three pattern:
- Long Bearish Candles: The pattern consists of three long bearish candles, suggesting sustained selling pressure in the market.
- Small Real Bodies: The real bodies of the candles are small, indicating a tight trading range and potential indecision among traders.
- Bearish Trend Continuation: After a downtrend is established, the Bearish Falling Three pattern signals a likelihood of the bearish trend persisting.
- Short Positions: Traders often use this pattern as a signal to enter short positions or reinforce existing bearish trades.
For day traders, understanding the nuances of the Bearish Falling Three pattern is essential for making informed decisions and implementing successful day trading strategies. By recognizing this pattern, traders can position themselves strategically to benefit from potential downward market movements.
Most Accurate Candlestick Pattern
In addition, one of the most sought-after aspects in day trading strategy development is identifying the candlestick pattern that offers the highest level of accuracy. While the most accurate candlestick pattern for day trading is subjective and varies among traders, some commonly recognized patterns include the Bullish Engulfing, Three White Soldiers, Shooting Star Candlestick, and Evening Star Pattern.
These patterns are often used in candlestick trading strategies to gauge potential market direction changes. Traders analyze these patterns through candlestick analysis, considering factors such as market conditions, timeframe, and confirmation signals to validate their accuracy. It is essential for traders to backtest these patterns and practice incorporating them into their strategies to assess their effectiveness in real-time trading scenarios.
Additionally, combining these candlestick patterns with other technical indicators and risk management techniques can enhance the overall accuracy and reliability of these signals in day trading operations.
3 Candlestick Rule
The Candlestick Rule in day trading emphasizes the importance of patterns formed by consecutive candlesticks.
These patterns provide valuable insights into market sentiment and potential trend reversals.
Analyzing candlestick chart data is essential for traders seeking to make well-informed decisions and enhance their trading strategies.
Candlestick Patterns Significance
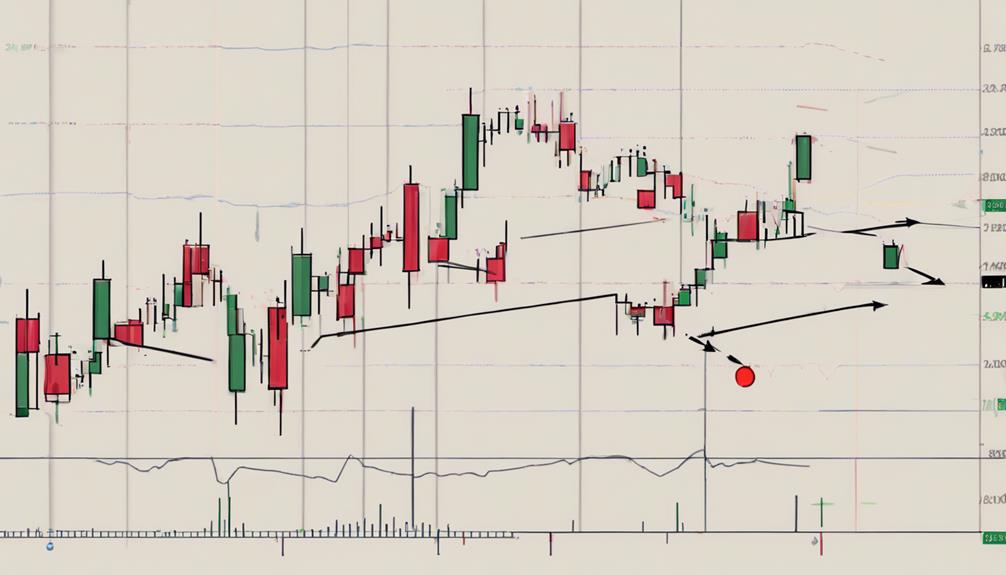
Analyzing candlestick patterns is a fundamental aspect of day trading strategy, particularly in the context of the Candlestick Rule. When examining candlestick patterns for day trading, their significance lies in predicting trend reversals and potential market movements. Key patterns such as Three White Soldiers and Three Black Crows exemplify the Candlestick Rule in action, providing insights into potential uptrends and downtrends.
Understanding the sequence and formation of these patterns can help day traders confirm possible changes in market direction, aiding in decision-making processes. By utilizing the Candlestick Rule and recognizing the implications of specific candlestick patterns, traders can enhance their ability to interpret market signals accurately and react effectively to changing market conditions.
- Analyzing candlestick patterns is crucial for day trading strategy.
- Candlestick patterns like Three White Soldiers and Three Black Crows signify trend reversals.
- The Candlestick Rule helps traders predict market movements based on patterns.
- Understanding candlestick patterns aids in confirming potential trend changes.
Interpreting Candlestick Chart Data
Interpreting Candlestick Chart Data plays a pivotal role in day trading strategy, providing valuable insights into market sentiment and potential trend reversals. The Candlestick Rule involves analyzing patterns formed by three consecutive candles to predict potential trend reversals accurately.
By closely observing the sequence of higher or lower openings and closings, traders can identify shifts in market sentiment and anticipate changes in price direction. Patterns like Three White Soldiers or Three Black Crows exemplify the Candlestick Rule in action, aiding traders in making informed decisions.
Understanding the nuances of candlestick charting, particularly the three-candle pattern analysis, is a valuable tool for day traders seeking confirmation of trend changes and maximizing profitability in the market.
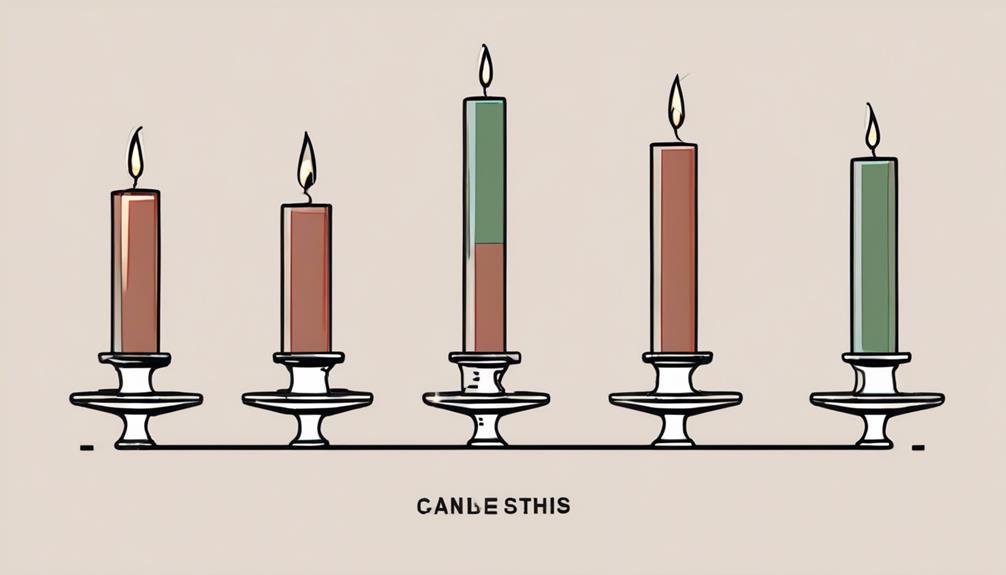
Interpreting Candlesticks

Utilizing candlestick charts in day trading allows for a nuanced understanding of market dynamics and price trends. When interpreting candlesticks, traders should focus on key elements to make informed decisions:
- Real Body: The real body of a candlestick represents the difference between the open and close prices. A long real body indicates strong buying or selling pressure.
- Upper and Lower Shadows: Shadows, or wicks, show the price range between the high and low points. Long shadows suggest market uncertainty or potential trend reversals.
- Candlestick Patterns: Recognizing patterns like hammers, dojis, and engulfing patterns can signal shifts in market sentiment and potential price movements.
- Market Sentiment: Analyzing candlestick patterns helps in understanding the prevailing market sentiment, identifying possible trend changes, and predicting future price movements accurately.
Frequently Asked Questions
How to Read Candlestick Chart for Day Trading for Beginners?
When delving into candlestick basics for day trading beginners, understanding how to read candlestick charts is essential. By grasping interpretation techniques, recognizing patterns, and conducting chart analysis, traders can gauge market sentiment effectively.
Implementing day trading strategies that consider trading psychology can enhance decision-making. Proficiency in these areas allows traders to identify trends and crucial price levels, aiding in executing profitable trades efficiently.
How to Master Candlestick Pattern?
Mastering candlestick patterns involves:
- In-depth understanding of candlestick basics
- Precise pattern recognition
- Thorough chart analysis
- Strategic trading approaches
- Trend identification
- Effective risk management
Just as a skilled artist meticulously studies brush strokes to create a masterpiece, traders must scrutinize candlestick formations to decipher market trends and make informed decisions. By honing these skills, traders can navigate the complexities of the market with confidence and precision.
What Is the 3 Candle Rule?
The 3 Candle Rule is a key aspect of candlestick psychology in day trading. It involves analyzing three consecutive candlesticks to identify potential trend reversals.
Traders use this rule to assess market sentiment, anticipate price movements, and inform trading strategies.
How Do You Memorize Candlestick Patterns?
To memorize candlestick patterns effectively, practice regularly, use visual aids like flashcards, and create mnemonic devices for each pattern.
Group study sessions can enhance learning through discussion and repetition exercises. By incorporating these techniques, traders can reinforce their memory and improve recognition skills.
Consistent review and application of these methods will lead to a deeper understanding and mastery of candlestick patterns for successful day trading.
Conclusion
To sum up, mastering reading candlestick charts for day trading requires a deep understanding of the components, patterns, and rules associated with them.
By learning to interpret candlesticks accurately, traders can gain valuable insights into market trends and make informed decisions.
Just as a skilled artist reads the brushstrokes on a canvas, a proficient trader can decipher the language of candlesticks to navigate the complexities of the financial markets with precision and insight.