
Developing a winning strategy in candlestick pattern trading involves mastering pattern recognition and implementing effective risk management techniques. Understanding key reversal, continuation, and indecision patterns is essential for making informed trading decisions. By combining these patterns with sound risk management practices, traders can optimize their chances of success in the financial markets. Enhancing trade success with reversal patterns and integrating thorough analysis with strategic money management further boosts profitability and safeguards capital. This strategic approach can lead to improved trading outcomes and increased confidence in maneuvering the complexities of candlestick trading. Explore deeper insights to refine your trading strategy.
Understanding Candlestick Pattern Basics
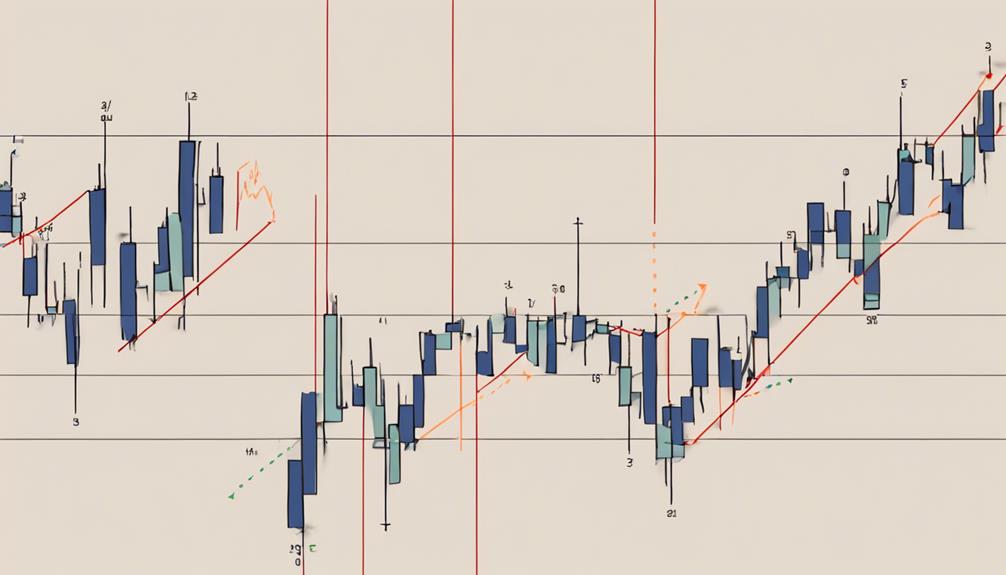
In delving into the domain of technical analysis, a fundamental aspect that traders must grasp is the thorough understanding of the basic principles underlying candlestick patterns. Candlestick patterns, consisting of real bodies, wicks, opening/closing prices, and colors representing price changes, offer a visual representation of price movements in the market.
The real body of a candlestick illustrates the price range between the opening and closing prices over a specific period, while the wicks indicate the highest and lowest price levels reached. These patterns visually narrate the ongoing battle between buyers and sellers, providing valuable insights into market sentiment.
Recognizing Key Reversal Patterns
Key reversal patterns such as the Bullish Engulfing, Morning Star, and Evening Star carry significant implications for traders. These patterns serve as essential indicators of potential changes in market sentiment and price direction.
Understanding their characteristics and how to spot them is fundamental for executing successful trading strategies.
Identifying Bullish Engulfing Pattern
Identifying the Bullish Engulfing pattern is an important aspect of recognizing key reversal patterns in candlestick pattern trading strategy. This pattern typically appears during a downtrend and indicates a potential shift towards bullish sentiment in the market.
Traders often seek out the Bullish Engulfing pattern at key support levels as it can confirm a trend reversal. The significance of this pattern increases when the engulfing candle is accompanied by higher-than-average trading volume, suggesting strong buying pressure.
To confirm the Bullish Engulfing pattern, traders usually wait for the following candle to open higher, validating the potential bullish reversal. It is essential for traders to understand these aspects to effectively utilize the Bullish Engulfing pattern in their trading strategies.
Understanding Morning Star Formation
Recognizing the Morning Star Formation plays a pivotal role in identifying potential bullish reversal opportunities within candlestick charts.
The Morning Star formation is a bullish reversal pattern characterized by three candles: a long bearish candle, a small-bodied candle or doji, and a long bullish candle.
This pattern typically signals a potential trend reversal from bearish to bullish, providing traders with a potential buying opportunity.
Confirmation of the Morning Star pattern usually occurs when the subsequent bullish candle opens above the previous candle's close.
Traders often look for this formation at the end of a downtrend as it signifies a shift in market sentiment towards a more positive outlook, indicating a potential reversal in the current trend.
Spotting Evening Star Signal
Spotting the Evening Star signal in candlestick charts is essential for traders seeking to identify potential trend reversals and make informed trading decisions based on key reversal patterns. Comprising a large bullish candle, a small-bodied candle or doji, and a bearish candle, this pattern signals a shift from bullish to bearish sentiment, indicating a potential weakening of buying pressure.
Traders often wait for confirmation through additional indicators or price action before acting on the pattern. The Evening Star formation holds more weight following a strong uptrend, suggesting a possible change in market sentiment. Recognizing this pattern enables traders to anticipate market movements and implement effective risk management strategies in their trading approach.
Identifying Continuation Patterns
Continuation patterns play a significant role in candlestick trading, indicating a temporary halt in the existing market trend.
Key continuation patterns such as Bullish Flags, Bearish Pennants, and Triangle Patterns serve as valuable signals for traders.
Recognizing these patterns aids traders in confirming the ongoing trend's strength before making strategic trading decisions.
Spotting Bullish Flags
Bullish flags in candlestick pattern analysis signify a temporary pause in an uptrend following a significant price increase, indicating a consolidation phase before a potential continuation of the upward movement. Traders often watch for breakout opportunities above the upper trendline of the flag to contemplate entering long positions. These patterns typically form after a strong price move higher, with the flagpole representing the initial sharp rise and the flag itself being a small parallel channel consolidation phase. Bullish flags are considered bullish signals, offering traders the chance to capitalize on trend continuation.
- Bullish flags represent a temporary pause in an uptrend.
- Traders seek breakouts above the upper trendline of the flag.
- The flagpole marks the initial sharp price rise.
- Flag patterns provide opportunities for trend continuation.
Recognizing Bearish Pennants
Characterized by converging trendlines forming a small symmetrical triangle shape, bearish pennants are continuation patterns that indicate a brief halt in a downtrend before resuming downward momentum. Traders observe these patterns for a breakout below the lower trendline as confirmation of the bearish signal, signaling the potential continuation of the downtrend.
During the formation of bearish pennants, there is typically a decrease in volume, suggesting a lack of interest before the price decline. Recognized as reliable patterns when correctly identified, bearish pennants can assist traders in anticipating future price movements within a downtrend.
Understanding Triangle Patterns
Triangle patterns in candlestick trading often serve as reliable indicators of the market trend's potential continuation.
These patterns, namely symmetrical triangles, ascending triangles, and descending triangles, offer insights into the market sentiment and potential price movements.
When traders encounter symmetrical triangles, they face market indecision before a possible breakout. On the other hand, ascending triangles typically signal a bullish continuation, while descending triangles suggest a bearish continuation.
To make informed trading decisions based on these patterns, traders often seek volume confirmation to validate the breakout direction. Understanding the nuances of triangle patterns can empower traders to anticipate and act upon market trends effectively.
Utilizing Indecision Patterns

In trading analysis, the interpretation of price action through indecision patterns, such as Doji, Dragonfly Doji, Gravestone Doji, and Star Doji, plays a significant role in recognizing potential market reversal signals.
Doji patterns, characterized by opening and closing prices that are nearly equal, signify market indecision. Dragonfly Doji patterns, identified by a long lower wick and a small body, suggest potential bullish reversals.
On the other hand, Gravestone Doji patterns, with a long upper wick and a small body, signal potential bearish reversals. Star Doji patterns exhibit indecision with a small real body and long upper and lower wicks.
Traders can utilize buy stop orders above the high of Doji patterns during strong trends to increase long exposure. Understanding these patterns can provide valuable insights for traders looking to capitalize on potential market reversals efficiently and effectively.
Implementing Risk Management Techniques
Building a solid foundation for successful candlestick pattern trading involves skillfully implementing risk management techniques to safeguard capital and optimize trading outcomes. Traders in this field can mitigate risks and enhance their chances of success by following certain strategies:
- Setting Stop-Loss Orders: Implementing proper risk management involves setting stop-loss orders to limit potential losses when trading based on candlestick patterns.
- Utilizing Position Sizing: Traders can control the amount of capital at risk on each trade by employing position sizing strategies aligned with their risk tolerance levels.
- Assessing Risk-Reward Ratio: Evaluating potential trades using a risk-reward ratio enables traders to determine if the expected profit justifies the potential loss in candlestick pattern trading.
- Embracing Diversification: Diversifying trades across various assets or markets can effectively reduce overall risk exposure, contributing to long-term success in candlestick pattern trading.
Regularly reviewing and adapting these risk management techniques based on market conditions and trading performance are essential for maintaining a sustainable trading approach.
Enhancing Trade Success With Reversal Patterns
Enhancing trade success with reversal patterns involves strategically identifying key candlestick formations that signal potential shifts in price direction, thereby offering lucrative trading opportunities.
Reversal patterns such as the Hammer and Hanging Man are important as they indicate potential changes in price direction after a trend. Additionally, patterns like Bullish Engulfing and Bearish Engulfing signify trend reversals with strong momentum, providing traders with opportunities to capitalize on significant price movements.
Abandoned Baby patterns are also significant, suggesting shifts in market sentiment and potential trend reversals, enabling traders to enter or exit positions at favorable times. Pin Bar Reversals create high probability trading setups by waiting for price breaks above or below the high or low, offering clear entry and exit points.
Additionally, Inside Bars play an important role in signaling both trend reversals and continuations based on price breaks above or below the previous bars' high or low, aiding traders in making well-informed decisions based on market dynamics.
Combining Analysis With Money Management
Implementing an essential money management strategy is fundamental for traders looking to protect capital and optimize trading performance in candlestick pattern analysis. In this scenario, combining thorough analysis with effective money management techniques is important for achieving success in trading.
To achieve this, traders should consider the following key points:
- Setting stop-loss orders based on individual risk tolerance and trade setup to minimize potential losses.
- Calculating the appropriate position size by considering the risk percentage per trade, ensuring long-term sustainability.
- Implementing a risk-reward ratio to make sure that potential profits outweigh potential losses in each trade.
- Employing effective money management strategies to protect capital, minimize losses, and enhance overall trading performance.
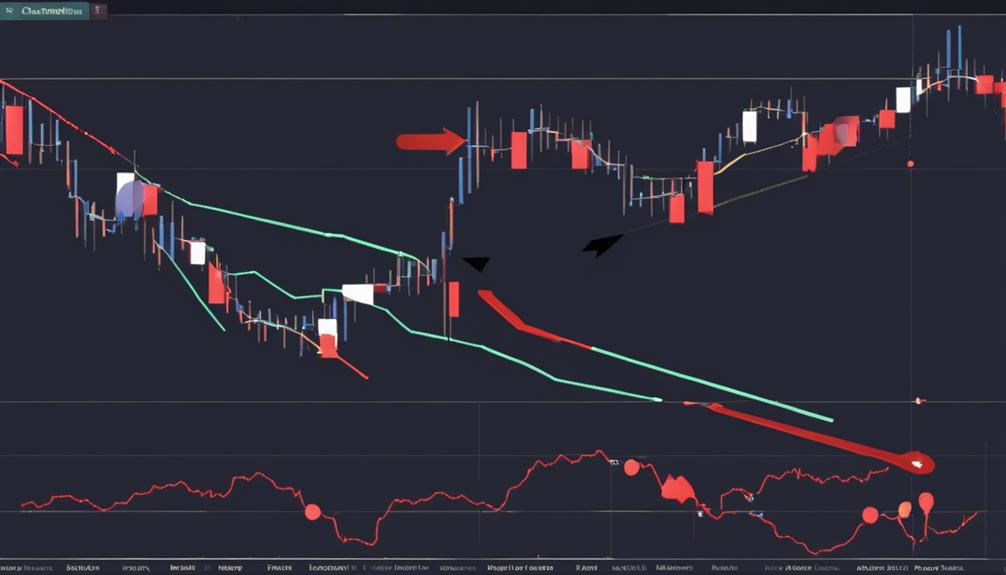
How Can RSI Settings Be Incorporated into Candlestick Pattern Trading for Maximum Success?
Incorporating the best RSI settings for trading success into candlestick pattern trading can maximize your chances of making profitable trades. By using the right RSI settings, traders can make more informed decisions about when to buy or sell based on overbought or oversold conditions indicated by the RSI.
Frequently Asked Questions
What Is the 3 Candle Rule?
The 3 Candle Rule in candlestick pattern trading is a technique that involves analyzing the most recent three candles on a price chart. By examining the patterns formed by these candles, traders can identify potential trends or reversals.
This rule helps gauge market momentum and sentiment, aiding in decision-making. Understanding the 3 Candle Rule enhances a trader's ability to recognize trading opportunities and manage risk effectively through candlestick pattern analysis.
Which Is the Most Profitable Candlestick Pattern?
In the domain of candlestick pattern trading, different patterns exhibit profitability under diverse market conditions. Prominent contenders for the most profitable candlestick pattern include the Engulfing pattern, Hammer pattern, Doji pattern, Shooting Star, Morning Star, Evening Star, Harami pattern, Piercing pattern, Dark Cloud Cover, and Hanging Man.
Each pattern conveys distinct market sentiment and potential price movements, contributing to traders' strategies for best decision-making.
What Is the Best Candlestick Strategy?
When considering the best candlestick strategy, traders should evaluate various factors such as market conditions, timeframe, and risk tolerance. Each candlestick pattern, including Bullish Engulfing, Bearish Harami, Morning Star, Evening Star, Hammer Pattern, Shooting Star, Doji Reversal, Tweezer Bottom, Hanging Man, and Inverted Hammer, serves a specific purpose in identifying potential market movements.
Incorporating these patterns with technical analysis can enhance decision-making and improve trading outcomes.
What Is the 3 Candle Strategy?
The 3 Candle Strategy in candlestick analysis is a trading strategy that focuses on pattern recognition within three consecutive candlesticks.
This approach, rooted in technical analysis, aids in understanding market trends and potential reversals.
By scrutinizing price action, traders can pinpoint entry points and exit signals, optimizing risk management and profit potential.
The 3 Candle Strategy is a valuable tool for traders seeking precision and accuracy in their trading decisions.
Conclusion
To sum up, mastering candlestick patterns is essential for successful trading. By understanding key reversal, continuation, and indecision patterns, traders can make informed decisions.
Implementing risk management techniques and combining analysis with money management strategies can further enhance trade success.
Remember, in the world of trading, knowledge is power, and mastering candlestick patterns can give traders the edge they need to succeed in the markets.
Just as a skilled painter uses different brushstrokes to create a masterpiece, traders can utilize candlestick patterns to craft winning strategies in their trading endeavors.