
Your initiation into Gann Theory opens doors to predicting market movements through geometric shapes and time elements. Gann Angles like 1×1, 1×4, and 1×8 are fundamental tools for forecasting support and resistance levels. Understanding the relationship between price and time is crucial to effectively utilizing Gann Theory principles. With Gann Theory, you gain insights into market trends, price shifts, and strategic decision-making. Exploring the applications, strategies, and indicators of Gann Theory reveals a thorough approach to financial analysis and trading. Discover the precision of Gann Theory in deciphering market dynamics for informed decision-making.
What Is Gann Theory?
The Gann Theory, developed by W.D. Gann in the early 1900s, is a technical analysis tool utilized for predicting future price movements in the stock market through the application of geometric shapes and time cycles.
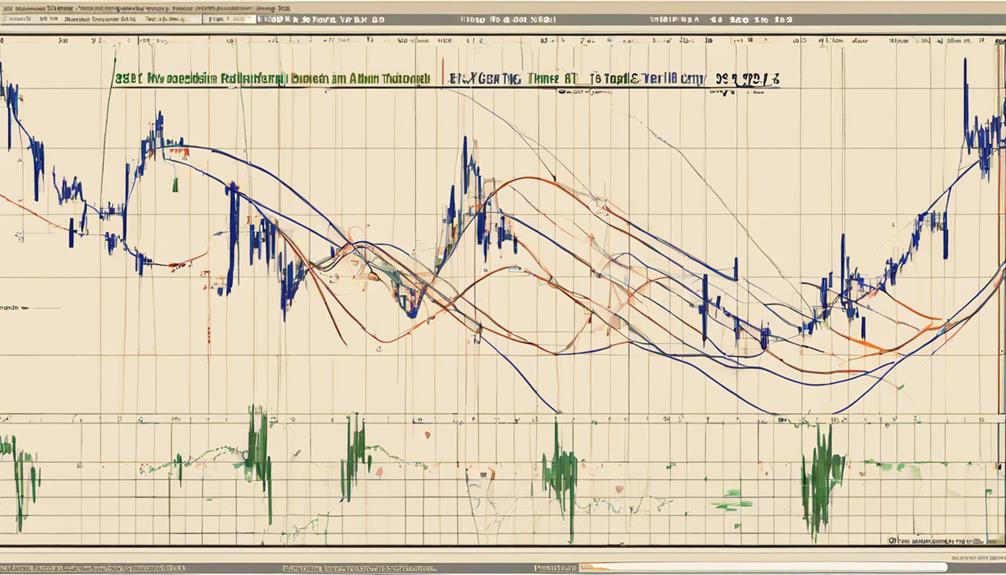
Central to Gann Theory are Gann angles, which are used to forecast support, resistance, and trend direction based on specific angles like 1×1, 1×2, and others. These angles are derived from the relationship between price and time, providing traders with valuable insights into potential price movements.
By analyzing these angles on price charts, traders can anticipate key price levels and potential trend changes. The theory asserts a high level of accuracy, up to 90%, in predicting asset movements by examining patterns and angles on price charts.
Traders rely on Gann Theory to make informed decisions by closely studying price movements, pivot levels, and pattern formations, enhancing their ability to navigate the dynamic stock market landscape effectively.
Understanding Gann Angles
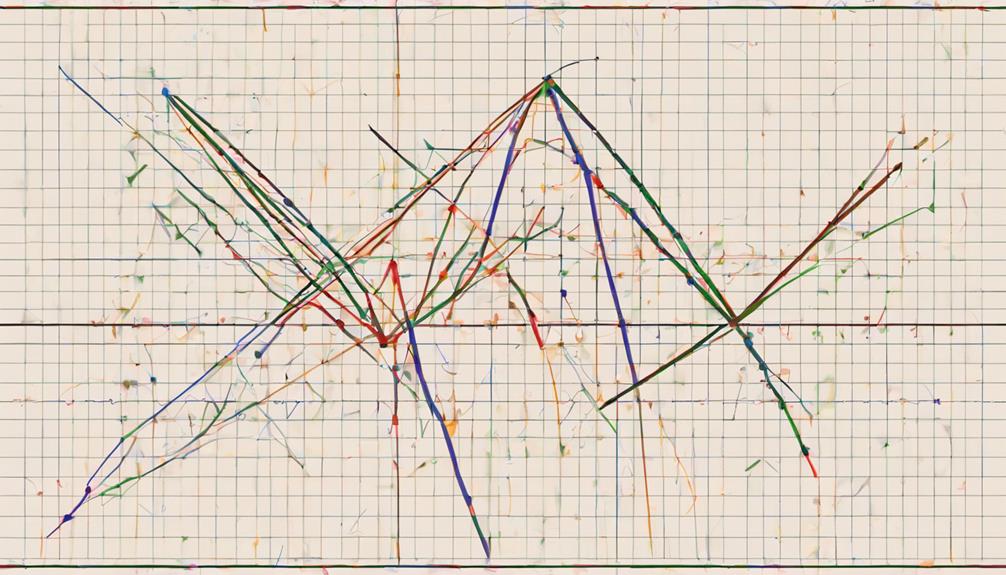
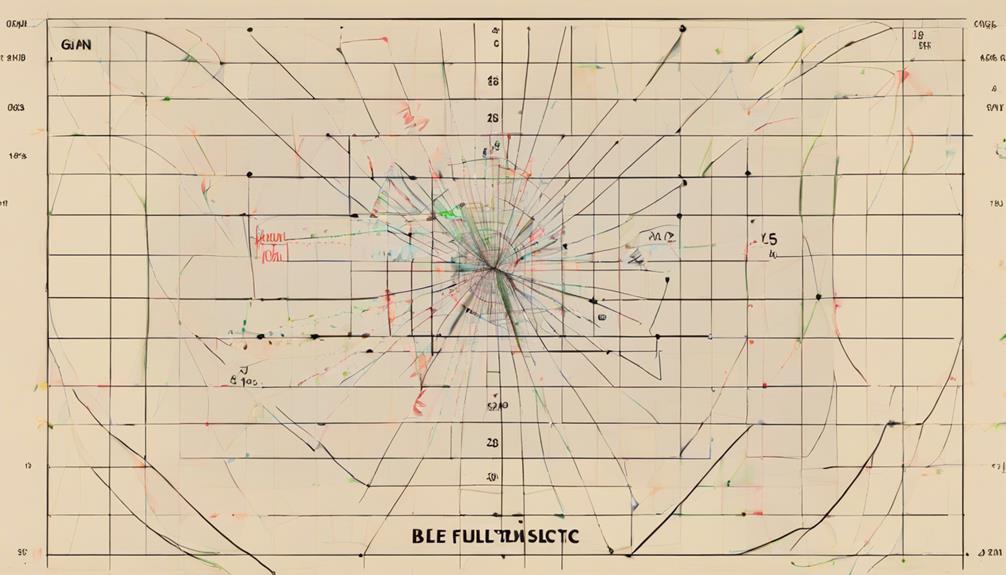
Gann angles, also known as Gann lines, play a significant role in technical analysis by providing insights into potential price movements. These angles are derived from the relationship between price and time, helping traders identify key levels of support and resistance.
Gann Angles Basics
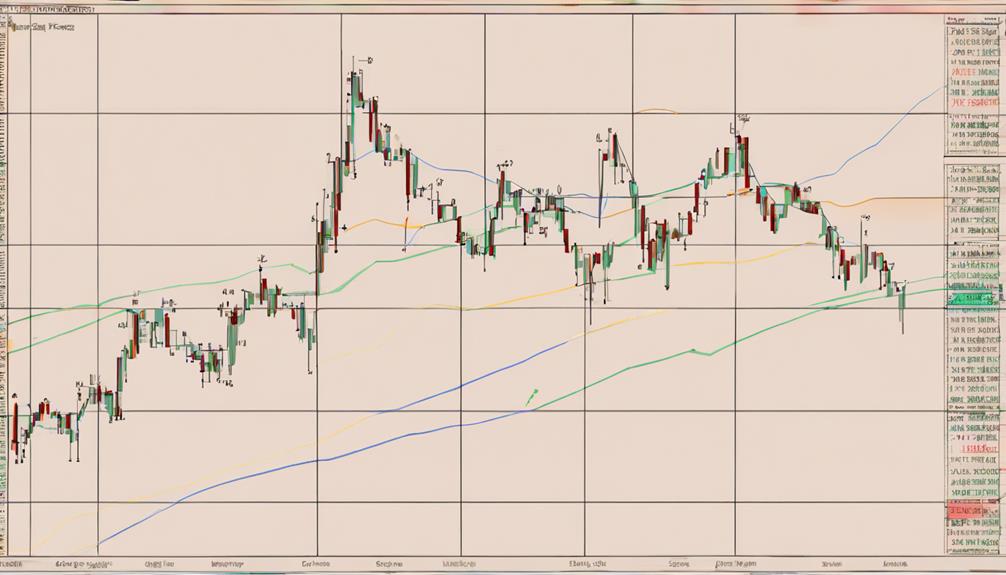
Utilizing Gann angles in technical analysis provides traders with valuable insights into potential future price movements. These angles, represented by diagonal lines on price charts, offer important support and resistance levels.
Each angle, such as the 1×8, 1×4, and 1×3, provides specific guidance on potential price movements. The 1×1 angle, reflecting a 45-degree angle, holds particular significance as it signifies a balance between time and price.
Traders often observe a significant market shift when prices breach the 1×1 trend line, indicating a possible trend reversal. Understanding the basics of Gann angles and their implications can assist traders in making informed decisions based on the predicted support and resistance levels these angles provide.
Applying Gann Angles
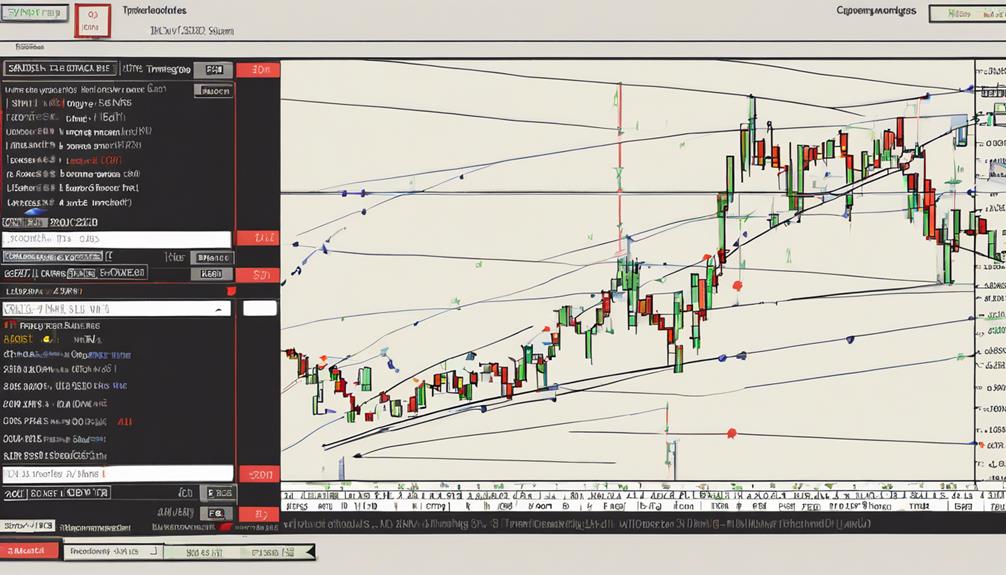
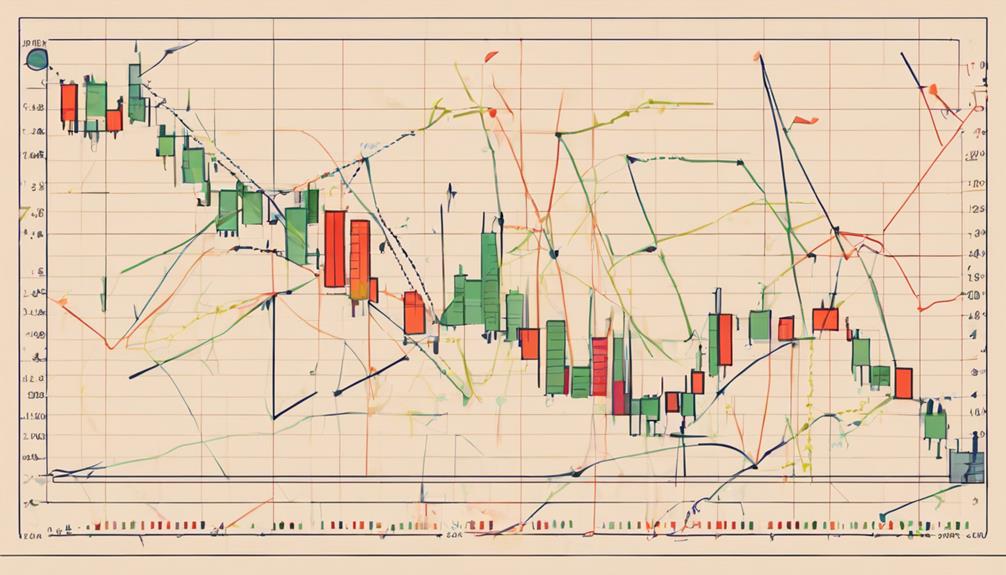
When integrating Gann angles in technical analysis, traders can gain valuable insights into potential price movements through the analysis of diagonal lines on price charts. These angles, such as the 1×1, 1×2, and 1×4, offer unique characteristics that aid in predicting price movements.
By observing how prices interact with these angles, traders can identify significant support and resistance levels. Major reversals often occur when prices breach the 1×1 trend line according to Gann angle theory.
Analyzing the patterns and angles of assets using Gann angles enables traders to make informed decisions and anticipate future price movements accurately. Incorporating Gann angles into technical analysis can enhance traders' abilities to interpret and forecast market trends effectively.
Gann Theory Basics
Developed by William D. Gann in the early 1900s, the foundational principles of Gann Theory lay the groundwork for predicting future price movements based on geometric shapes and time. Gann Theory utilizes Gann Angles, which are lines drawn at specific angles on price charts to predict future support and resistance levels. These angles, such as the 1×1, 1×4, and 1×8, play a vital role in identifying potential price movements. The 1×1 angle, for instance, represents a 45-degree angle and is considered a key indicator in Gann Theory analysis. By understanding these angles and their significance, traders can anticipate price levels where an asset may find support or face resistance.
Gann Theory's approach to analyzing market movements through geometric patterns and angles provides traders with a unique perspective on potential price action. By studying historical price movements and applying Gann's principles, investors can gain insights into possible future trends and make more informed trading decisions based on these predictive models.
Gann Theory Applications
The practical implementation of Gann Theory in financial analysis enhances traders' ability to anticipate future market movements with a unique perspective based on geometric patterns and angular relationships.
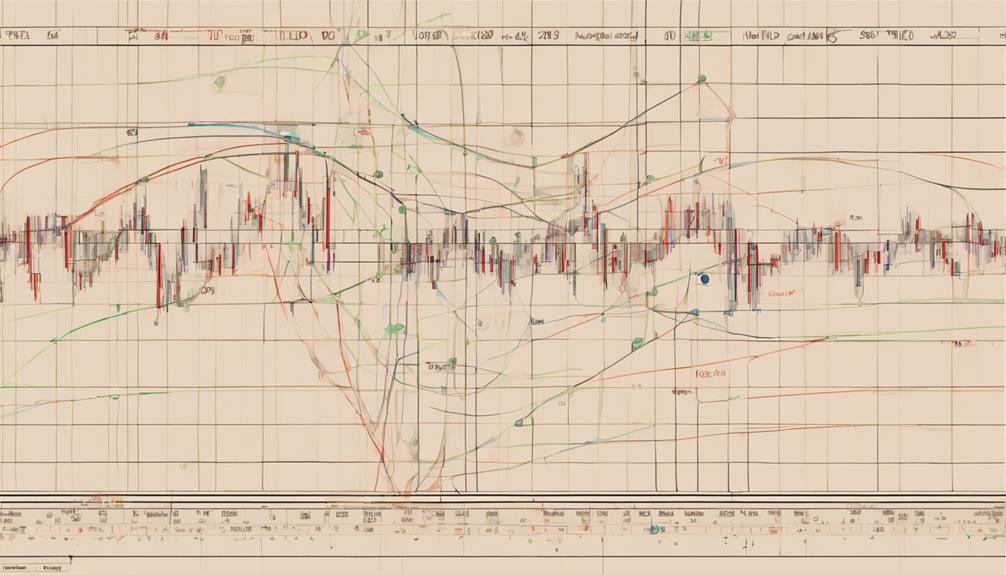
Gann angles play an essential role in this application, as they help predict future price movements by connecting tops and bottoms in trends. These angles also provide important support and resistance levels, forming diagonal lines with consistent speed.
Different Gann angles such as 1×1, 1×2, and 2×1 indicate trend strength and direction, offering traders valuable insights into potential breakouts and trend reversals in the market.
Gann Trading Strategies
Gann Trading Strategies revolve around the concepts of Time and Price, as well as the Square of Nine.
These strategies utilize Gann angles to pinpoint areas of support and resistance within the market structure.
Understanding the interplay between angles and key horizontal lines is crucial for traders looking to implement effective Gann-based trading decisions.
Time and Price
Analyzing the intersection of time and price movements is vital in implementing effective Gann trading strategies. Gann angles, derived from the geometric relationship between time and price, assist traders in predicting future price movements. These angles are essential for identifying key support and resistance levels within the market.
By understanding time cycles and utilizing Gann angles, traders can make informed decisions based on the interaction of time and price factors. Gann's approach, which integrates price, time, and range elements, provides a thorough framework for market analysis.
Successful application of Gann theory hinges on recognizing the significance of time and price relationships, enabling traders to navigate the complexities of the financial markets with precision and insight.
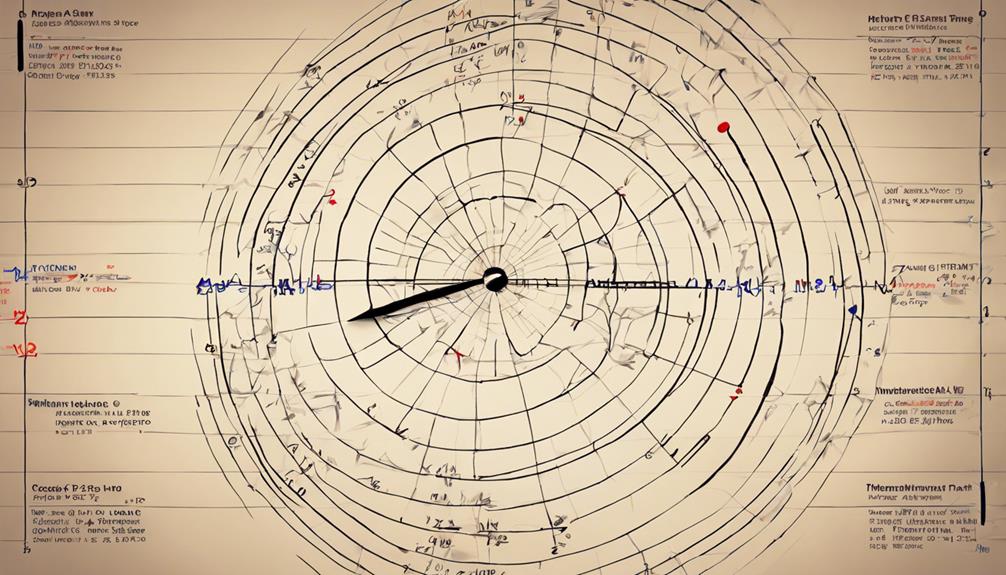
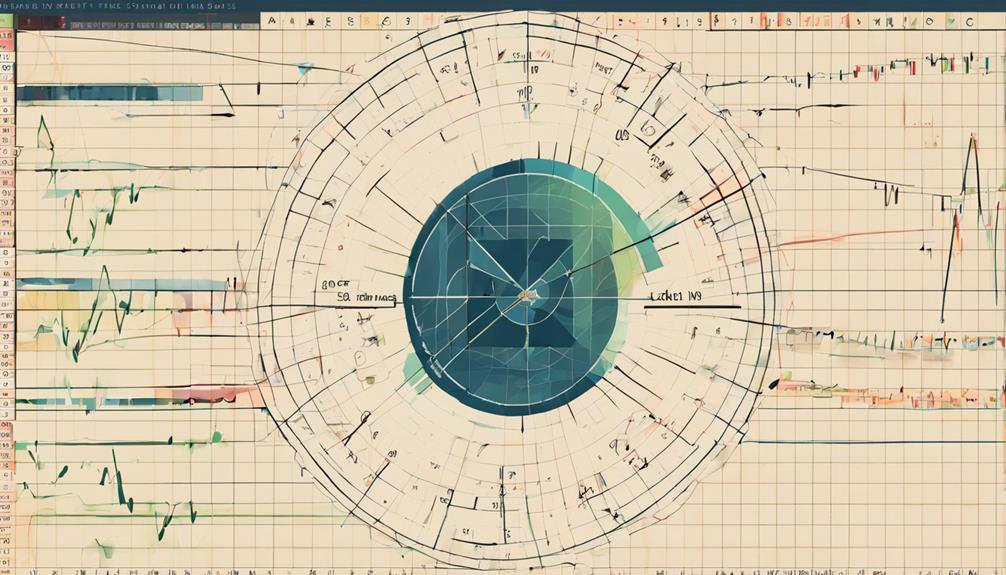
Square of Nine
Utilizing the Square of Nine trading tool enhances traders' ability to forecast price levels and anticipate market reversals with precision and geometric accuracy. This Gann tool, known for its spiral pattern of numbers, aids traders in identifying important support and resistance levels.
Here are three key aspects of the Square of Nine:
- Geometric Precision: The Square of Nine enables traders to apply Gann angles and geometric calculations to determine potential price targets accurately.
- Support and Resistance: Traders use the tool to pinpoint key support and resistance levels, helping them make informed trading decisions.
- Market Reversals: By analyzing the Square of Nine, traders can anticipate market reversals and turning points, enhancing their trading strategies based on calculated price movements.
Gann Indicators Explained
When delving into the domain of technical analysis in financial markets, understanding Gann indicators becomes vital for traders seeking to navigate price chart movements effectively. Gann indicators are trading techniques developed by W.D. Gann that utilize Gann angles to predict support and resistance levels in the market.
These indicators are pivotal in helping analysts predict market tops, bottoms, and future price movements with high accuracy. By using Gann angles, analysts can measure patterns, prices, and time to conduct effective market analysis. Gann angles play an important role in determining trend strength, direction, and potential breakouts in asset prices.
Traders use Gann indicators to identify key levels where the price is likely to encounter support or resistance, aiding them in making informed trading decisions. Understanding and implementing Gann indicators can provide traders with valuable insights into market dynamics and help them anticipate potential price movements.
Gann Angles Vs. Trendlines
In comparing Gann angles to trendlines, traders can leverage distinct geometric properties and directional insights to enhance their analysis of market dynamics.
- Geometric Properties: Gann angles are diagonal lines that provide specific angles for predicting support and resistance levels, offering a holistic way to analyze price movements. On the other hand, trendlines connect swing highs and lows horizontally to show the overall trend direction over time, providing a more inclusive view of market trends.
- Directional Insights: Gann angles offer a more dynamic approach to price prediction by incorporating angles that can help traders identify potential areas of price movement. In contrast, trendlines provide a straightforward visual representation of the trend's direction without specific angle measurements.
- Enhanced Analysis: By utilizing both Gann angles and trendlines in conjunction, traders can gain a thorough understanding of market dynamics. Gann angles provide insights into potential price levels, while trendlines offer a clear depiction of the trend's direction, enabling traders to make more informed decisions regarding entry and exit points in the market.
Special Gann Considerations
An essential aspect to take into account when delving into Gann theory is the pivotal application of specialized Gann considerations in market analysis. Gann angles on charts play a significant role in identifying potential price movements and trend reversals. These angles, such as 1×1, 1×8, and 1×4, provide unique insights into the market dynamics. Unlike traditional trendlines, Gann angles incorporate both price and time, offering a holistic view of market behavior.
Gann theory emphasizes the importance of understanding geometric patterns and time cycles to make informed predictions about future price movements. By utilizing Gann angles alongside Gann lines, traders can better track price trends and anticipate key support and resistance levels. The predictive power of these angles enables traders to formulate effective trading strategies, including backtesting and stop-loss placement, to manage risks and optimize decision-making processes. Incorporating these specialized Gann considerations into market analysis can enhance the accuracy of price forecasts and improve overall trading outcomes.
Calculating Gann Angles
The foundation of Gann analysis involves precisely calculating Gann angles by deriving the slope of the line through the division of price by time. This fundamental concept forms the basis for Gann's unique approach to analyzing price charts.
Here are three key points to help you understand the significance of calculating Gann angles:
- Determining Slope: Gann angles are computed by dividing price movements by time intervals, revealing the slope of the trend line on a price chart.
- 1×1 Angle: The 1×1 Gann angle, representing a 45-degree angle on the chart, is the most commonly used angle in Gann analysis, indicating a balanced relationship between price and time.
- Support and Resistance Levels: Traders can adjust Gann angles to different degrees like 1×2, 1×4, or 2×1 to identify potential support and resistance levels, aiding in decision-making processes.
Gann Analysis Reliability
The reliability of Gann analysis lies in its proven accuracy rate of approximately 90% in predicting future price movements through geometric shapes and time-based analysis.
Traders benefit from the support and resistance levels provided by Gann angles, aiding in making well-informed trading decisions.
Gann's time study model further enhances the reliability of predicting stock value reversals with a high degree of precision.
Gann Theory Accuracy
Demonstrating a remarkable level of accuracy, Gann theory utilizes angles to predict asset movements with up to 90% reliability. This predictive value is derived from the alignment of Gann angles, aiding in the identification of vital support and resistance levels in the market.
Additionally, Gann angles play a pivotal role in forecasting market tops, bottoms, and trend changes, providing traders with a high level of confidence in their trading decisions.
- Gann theory claims up to 90% accuracy in predicting asset movements using Gann angles.
- Traders use Gann analysis for reliable support and resistance identification in the market.
- Gann angles help forecast tops, bottoms, and trend changes with a high level of reliability.
Consistency in Gann Analysis
Consistency in Gann analysis is achieved through the detailed alignment of price, time, and geometric patterns, ensuring reliable outcomes in market predictions.
The utilization of Gann angles, which are derived from the intricate relationship between price and time, enhances the accuracy of forecasting future price movements.
By meticulously studying geometric patterns such as squares, circles, and angles, Gann analysts can identify key levels of support and resistance, leading to more systematic predictions.
Additionally, Gann's methodology emphasizes the importance of waiting for confirmation from multiple indicators before making trading decisions, which further strengthens the reliability of his analysis.
This thorough approach to market analysis, considering various factors and patterns, contributes to the overall consistency and effectiveness of Gann theory in predicting market trends.
Gann Theory Examples
Utilizing geometric shapes and time cycles, Gann Theory examples offer valuable insights into predicting stock price movements. Here are three key aspects of Gann Theory examples:
- Gann Angles: Gann Theory involves the use of Gann angles at different degrees such as 1×1, 1×8, and 1×4, which help in determining important support and resistance levels for various assets. These angles are essential tools for traders to analyze price movements accurately.
- Forecasting Accuracy: Patterns and angles within Gann Theory can provide remarkably accurate forecasts of future price movements, with some studies suggesting prediction accuracies of up to 90%. This high level of precision makes Gann Theory a valuable tool for traders and analysts.
- Time Studies: Gann Theory application includes conducting time studies to track price movements, pivot levels, and potential reversals in stock values. By utilizing time cycles effectively, traders can enhance their understanding of market trends and make more informed decisions based on historical data and future projections.
Benefits of Gann Theory
An essential aspect of Gann Theory lies in its ability to provide traders with highly accurate predictions of asset movements by leveraging geometric shapes and time analysis.
By utilizing Gann angles, traders can pinpoint key support and resistance levels, enabling them to make well-informed decisions.
Gann Theory's emphasis on time analysis allows traders to track price movements, forecast trend reversals, and comprehend investor behavior more effectively.
This method equips traders with the tools to anticipate future price movements by employing pivot levels and time study models, enhancing their overall trading strategies.
The unique characteristics and angles of Gann angles, such as 1×1, 1×8, and 1×4, play an important role in predicting asset price changes and identifying potential trend shifts.
Traders benefit significantly from Gann Theory's thorough approach to analyzing the market, offering them a strategic advantage in understanding the complexities of the financial markets.
Frequently Asked Questions
How to Learn Gann Theory?
To learn Gann Theory effectively, individuals can engage in practice exercises to apply theoretical concepts practically. Enrolling in online courses dedicated to Gann Theory provides structured learning and access to expert guidance.
Additionally, seeking mentorship opportunities from experienced traders can offer valuable insights and personalized guidance in understanding the nuances of Gann Theory. By combining these approaches, individuals can develop a thorough understanding of Gann Theory and enhance their ability to predict market movements accurately.
How Accurate Is the Gann Theory?
Gann theory, known for its bold claims, boasts a high level of accuracy in predicting asset movements. This assessment is supported by the theory's practical applications in providing precise support and resistance levels through Gann angles.
The historical performance of Gann theory showcases its effectiveness in aiding traders to make informed decisions based on forecasted price reversals. Overall, the theory's track record demonstrates a notable level of accuracy in market analysis.
What Is the Golden Ratio of Gann?
The Golden Ratio in Gann Theory is a pivotal angle of 1:1 or 45 degrees used in market forecasting and trading strategies. This ratio, akin to Fibonacci analysis, symbolizes equilibrium and balance. It aids traders in identifying potential support and resistance levels. Gann emphasized its significance for discerning trend reversals and significant price movements.
Understanding this ratio enables informed decision-making based on geometric principles and historical price behavior.
What Are the Important Gann Levels?
Important Gann levels serve as critical support and resistance zones in technical analysis. Traders rely on these levels for identifying potential entry and exit points, as well as forecasting price targets and trend reversals.
Derived from geometric angles, Gann levels offer key insights into market behavior. Understanding these levels is essential for effective trading strategies, as they integrate Fibonacci ratios and time cycles to enhance decision-making processes in the financial markets.
Conclusion
To sum up, Gann Theory serves as a valuable tool for technical analysis in the financial markets. By utilizing Gann Angles and applying various strategies, traders can identify potential trends and price levels.
Like a compass guiding a ship through turbulent waters, Gann Theory provides traders with a sense of direction and helps navigate the complexities of market movements.
With practice and understanding, traders can harness the power of Gann Theory to make informed decisions in their trading endeavors.