
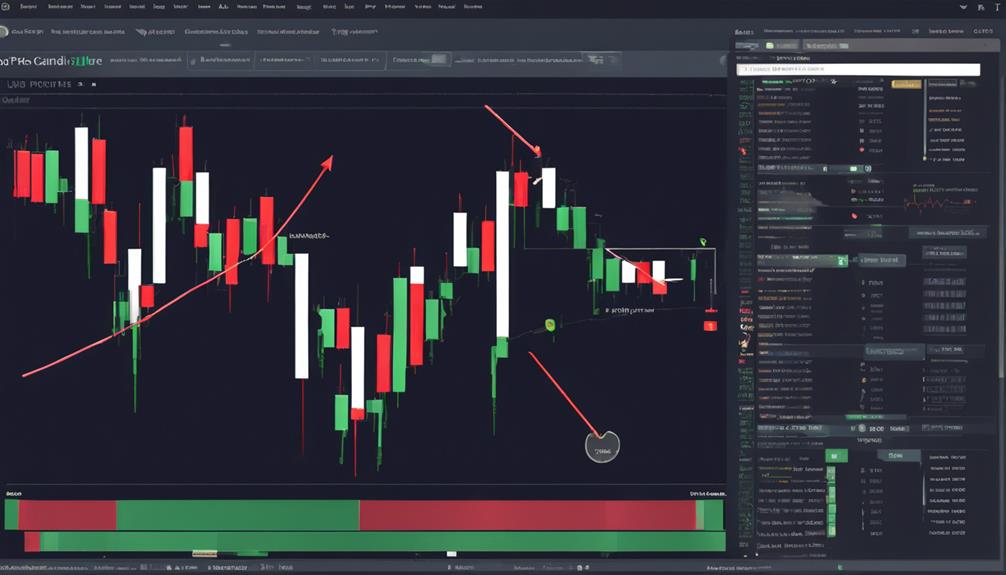
Mastering pivot point analysis involves understanding support/resistance levels, price behavior relative to pivots, and strategic trading decisions. Calculate central pivot points using high, low, close prices. Utilize these levels for entry/exit decisions and stop-loss orders in financial markets. Identify support as potential reversal points and resistance as trend reversal indicators. Analyze market sentiment through proximity to pivot points, validating with candlestick patterns and volume. Enhance trading decisions by integrating technical indicators with pivot points. Implement a meticulous approach to entry/exit points, confirming entries above pivot points and exits near support/resistance. Manage risk with stop-loss orders below support levels. Enhance skills by interpreting price behavior at pivot levels for ideal decision-making.
Understanding Pivot Point Calculation
In the domain of technical analysis for trading, a fundamental aspect to grasp is the methodical process involved in calculating pivot points based on the previous day's high, low, and close prices. Pivot points are essential technical analysis indicators that help traders identify potential price levels of support and resistance. By calculating the pivot, traders can determine the central point around which market trends may pivot. The central pivot point is calculated as the average of the high, low, and close prices from the previous day.
Support levels are considered price levels where a downtrend can be expected to pause or reverse, while resistance levels are where an uptrend may encounter barriers. Understanding how to calculate pivot points is crucial for making informed entry and exit decisions in trading. Traders often use pivot points to set stop-loss orders to manage risk effectively. Mastering the calculation of pivot points is key to utilizing this valuable tool in navigating the complexities of the financial markets.
Identifying Support and Resistance Levels
Support and resistance levels play an essential role in guiding traders' decision-making processes by indicating potential price reversal points in trading analysis. Support levels represent areas where the price tends to stop falling and potentially reverse, while resistance levels indicate where the price may stop rising and reverse its direction.
These levels are closely tied to pivot points, which serve as a central reference point for determining both support and resistance levels in trading. By identifying these key levels, traders can make informed decisions regarding entry and exit points, set appropriate stop-loss orders, and anticipate price movements more accurately.
Understanding support and resistance levels is vital for establishing profit targets and effectively managing trades based on price action. By incorporating these levels into their analysis, traders can enhance their strategies and increase the likelihood of successful trading outcomes.
Analyzing Price Behavior Relative to Pivots
Analyzing price behavior relative to pivot points involves closely monitoring the price proximity to these key levels and the reactions observed at pivot levels. Traders look for indications of whether prices are likely to bounce off or break through pivot points, which can provide valuable trend confirmation signals.
Additionally, examining confirmation signals such as candlestick patterns and volume near pivot points can help validate price movements and offer insights into market sentiment.
Price Proximity to Pivots
When considering price proximity to pivot points, traders can gauge market sentiment by observing whether trading activity aligns with the levels, indicating either a bullish or bearish bias. Price behavior relative to pivot points helps traders identify ideal entry and exit points, with trading above the pivot suggesting a bullish bias and below indicating bearish sentiment.
Confirmation signals like candlestick patterns and volume near pivot points validate price movements and assist in decision-making. Monitoring how prices react around pivot levels provides insights into market sentiment and potential trend changes. Understanding price proximity to pivot points is essential for setting profit targets, stop-loss levels, and refining trading strategies based on key support and resistance levels.
Reaction at Pivot Levels
Observing how prices interact at pivot levels provides valuable insights into market sentiment and aids traders in predicting potential trend changes. Traders analyze price behavior near support and resistance levels, looking for signs of price reversals, bounces, or breakthroughs. Confirmation signals such as candlestick patterns and changes in volume near pivot points help validate possible market movements.
Understanding how prices react to pivot levels is crucial for identifying best entry and exit points, as well as for setting stop-loss orders effectively. By closely monitoring price action at pivot levels, traders can make more informed decisions and improve their overall trading strategies in response to the dynamic nature of the market.
Making Strategic Trading Decisions
Strategic trading decisions based on pivot points are essential for traders aiming to time their trades effectively and manage risk wisely. By identifying key support and resistance levels, traders can make informed decisions on entry and exit points, enhancing the likelihood of successful trades.
Integrating pivot points with other technical indicators provides a holistic approach to decision-making in the dynamic landscape of the financial markets.
Timing Trades Effectively
Mastering the art of timing trades effectively is paramount for traders seeking to make informed and strategic trading decisions. Utilizing pivot points to identify key levels for entry and exit, support and resistance areas, and setting stop-loss orders near these levels enhances risk management and trade discipline. Analyzing price action, candlestick patterns, and volume around pivot points aids in determining ideal entry and exit points. Observing confirmations near pivot levels is vital for decision-making, ensuring that traders maximize their trading returns. By monitoring price movements and volume at pivot points, traders can make well-informed decisions, increasing the likelihood of successful trades.
| Key Elements for Effective Timing | Explanation | Importance |
|---|---|---|
| Pivot Points | Determine entry and exit levels | Essential for trade planning |
| Candlestick Patterns | Provide insights into market sentiment | Helps predict price movements |
| Volume | Confirms price action validity | Indicates strength of market moves |
| Stop-loss Orders | Protect capital from significant losses | Essential for risk management |
Managing Risk Wisely
When it comes to managing risk wisely in trading, strategic decision-making plays an essential role in safeguarding capital and maximizing trading returns.
Setting stop losses at pivot levels is important for defining exit points in the event of adverse price movements. Strategic entry decisions, guided by pivot point analysis, involve evaluating price behavior concerning support and resistance levels.
Risk management with pivot points entails identifying key levels for stop losses to protect trading capital effectively. This approach fosters disciplined trading and mitigates significant losses during market volatility.
Utilizing pivot points for stop loss placement aids traders in making informed decisions by establishing clear exit points based on key support and resistance levels.
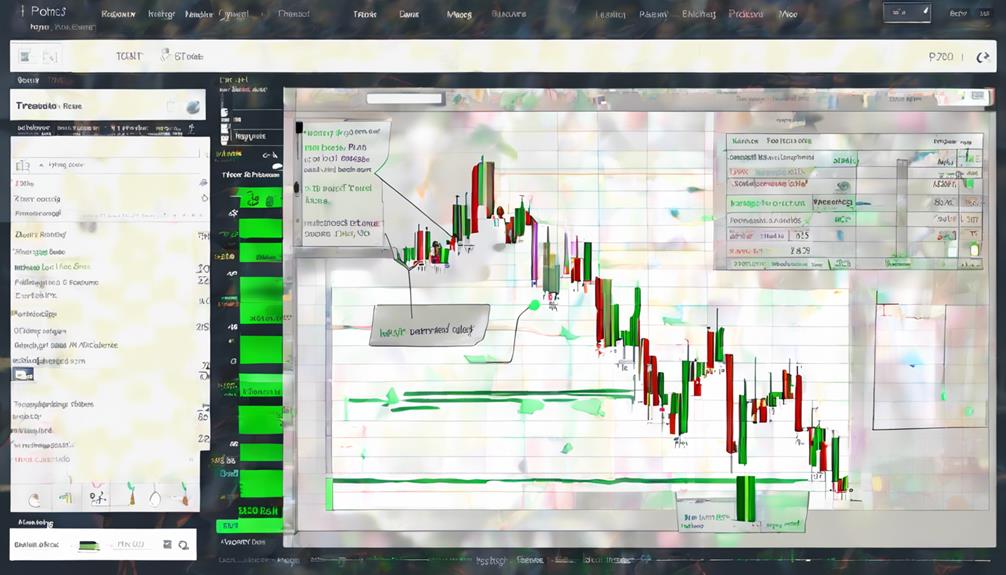
Implementing Effective Entry and Exit Points
Utilizing pivot point analysis effectively involves a meticulous approach to identifying entry and exit points in trading scenarios. When implementing pivot point trading strategies, traders must carefully identify support and resistance levels to determine entry and exit points. Entry points are often confirmed when prices break above the pivot point, indicating a bullish trend. It is essential to look for confirmation signals, such as candlestick patterns or changes in volume, to validate these entry points effectively.
Moreover, pivot points play a significant role in determining best exit points. Traders can consider exiting trades near support and resistance levels like R1, R2, S1, and S2 to secure profits or limit losses based on market conditions. Monitoring price action and volume around these key pivot levels is essential for making strategic decisions regarding entry and exit points. The table below illustrates the relationship between pivot points and effective entry and exit strategies:
| Entry Points | Exit Points |
|---|---|
| Break above pivot point | Near support/resistance levels |
| Confirmation signals | Based on market conditions |
| Candlestick patterns | Pivot point levels |
| Changes in volume | Strategic decisions |
Managing Risk With Stop Loss Orders
Implementing stop loss orders based on pivot points is a strategic method to effectively manage risk in trading scenarios. By setting stop loss orders below nearest support levels identified by pivot points, traders can minimize potential losses during price fluctuations. This approach guarantees structured support and resistance levels are utilized for stop loss placement, enhancing overall risk management and trading discipline.
Placing stop loss orders at pivot levels not only aids in managing risk but also provides a systematic way to navigate price fluctuations in the market. Essentially, pivot points act as a guide for traders to strategically place stop losses, thereby reducing the impact of unexpected market movements.
Incorporating stop loss orders based on pivot points is essential for traders looking to safeguard their investments and maintain a disciplined approach to risk management in the ever-changing landscape of trading.
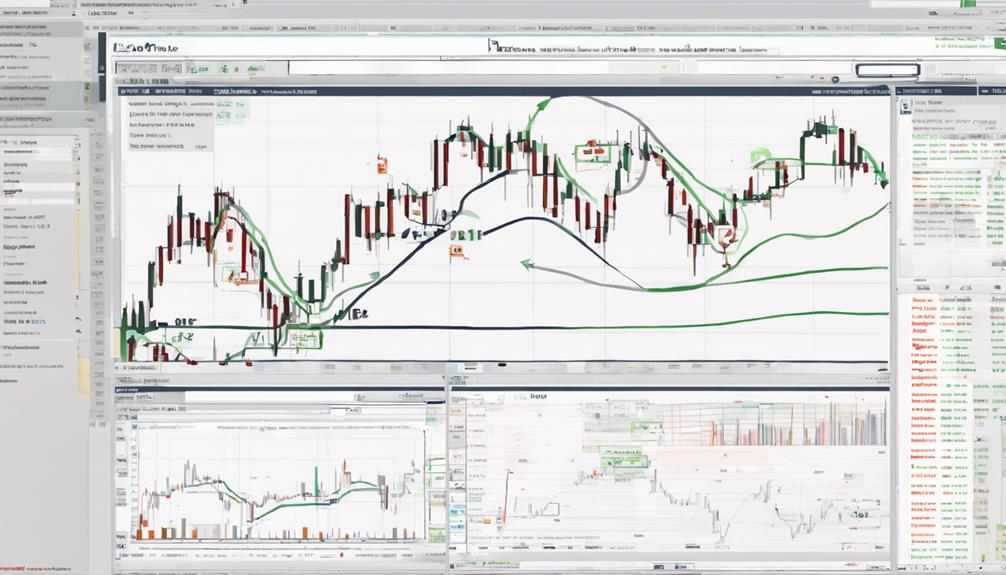
Enhancing Market Analysis Skills

Enhancing market analysis skills requires a deep understanding of interpreting price behavior at key pivot point levels. Pivot points play an important role in technical analysis by identifying key price levels where the market is likely to experience support or resistance. By incorporating pivot points into trading strategies, traders can effectively determine ideal entry and exit points. These key levels help in trend analysis, allowing traders to gauge the market sentiment and anticipate potential price reversals.
To enhance market analysis skills, it is essential to monitor how price behaves around pivot points. Analyzing price action and volume near these levels can provide confirmation of market movements, aiding traders in making informed decisions. Understanding market trends and patterns is fundamental for successful pivot point analysis, as it enables traders to adapt their strategies to changing market conditions. By mastering the interpretation of pivot points and their significance in market analysis, traders can improve their overall trading performance and profitability.
Frequently Asked Questions
How Do You Master Pivot Points?
Mastering pivot points in trading involves understanding:
- Candlestick patterns
- Support and resistance levels
- Trend identification
- Price action
- Fibonacci retracements
- Trading strategies
- Market psychology
- Risk management
By analyzing price action around pivot points and incorporating other technical indicators, traders can make informed decisions. Setting stop loss orders based on pivot points enhances risk management.
Backtesting results can validate the effectiveness of pivot point strategies in various market conditions.
Do Professional Traders Use Pivot Points?
Professional traders frequently utilize pivot points in their trading strategies to effectively navigate market trends, enhance risk management, and identify key support and resistance levels. These technical indicators assist traders in making informed decisions regarding entry and exit points, setting up stop-loss orders, and establishing profit targets.
Pivot points are an integral part of analyzing price action, confirming trading signals, and adapting to market dynamics for successful outcomes in various financial markets.
Which Pivot Point Is Best for Trading?
When considering the best pivot point for trading, it is essential to evaluate factors like daily pivots, Fibonacci retracements, intraday trading, support resistance, price action, candlestick patterns, trend analysis, market volatility, risk management, and technical indicators.
Each pivot point type offers unique insights into potential price movements, catering to different trading styles and strategies. Traders should experiment with various pivot point methodologies to determine the most effective approach aligning with their individual preferences and objectives.
How Do You Analyse Pivot Points?
Analyzing pivot points involves interpreting price action around key levels. Determining support and resistance levels is essential for trading decisions. Traders utilize candlestick patterns, market trends, and intraday trading data.
Fibonacci retracement levels can offer additional confirmation. Integrating pivot points with technical indicators enhances risk management strategies and aids in understanding trading psychology.
Conclusion
To sum up, mastering pivot point analysis requires a deep understanding of calculation methods, support and resistance levels, price behavior, strategic decision-making, entry and exit points, risk management, and market analysis.
By incorporating these elements into your trading strategy, you can navigate the market with precision and confidence.
Remember, in the world of trading, knowledge is power, and mastering pivot points is like having a compass in a sea of uncertainty.