
Mastering market volatility through standard deviation trading techniques involves evaluating risk, interpreting data, and adjusting strategies. Standard deviation quantifies dispersion and aids in setting profit targets by evaluating risk levels. Traders can manage risk effectively by calculating and interpreting standard deviation to modify strategies based on market conditions. Utilizing tools like Bollinger Bands enhances entry and exit points. Recognizing limitations and using complementary analysis improves accuracy. Implementing diverse analytical approaches and adapting to market changes enhance decision-making and profitability. Understanding these techniques is essential for maneuvering through volatile market conditions and developing effective risk management strategies. Additional insights await those seeking expertise in market volatility techniques.
Understanding Market Volatility
The comprehension of market volatility is essential for traders seeking to navigate the fluctuations in financial instrument prices with precision and strategic insight. Market volatility refers to the degree of variation in financial instrument prices over time, providing vital insights into market conditions.
It is a measure of the price deviation from the average, indicating the level of uncertainty or risk present in the market. Understanding market volatility is a key aspect of risk management in trading.
By monitoring volatility, traders can assess the level of risk associated with different assets and adjust their strategies accordingly. Incorporating market volatility into risk management practices allows traders to make more informed decisions when setting entry and exit points for trades.
Importance of Standard Deviation
Quantifying data dispersion around the mean, standard deviation plays a crucial role in evaluating risk and optimizing trading strategies effectively. Standard deviation is a key component in risk management within the financial markets.
By understanding the level of dispersion around the mean price, traders can assess the volatility of an asset. This insight is invaluable for setting appropriate profit targets, managing positions, and making well-informed trading decisions.
Higher standard deviation values indicate greater price variability, highlighting potential trading opportunities but also signaling increased risk. Traders rely on standard deviation to identify outliers, adjust their strategies according to market volatility, and anticipate potential price movements.
Utilizing standard deviation allows traders to establish risk parameters, enhance their risk management practices, and ultimately optimize their trading performance. By acknowledging the importance of standard deviation in measuring price variability and managing risk, traders can navigate the complexities of the market with greater precision and confidence.
Calculating Standard Deviation
In financial analysis and trading strategies, a vital aspect lies in accurately computing the standard deviation to evaluate asset volatility and quantify risk. Calculating standard deviation involves several steps.
Initially, find the mean average closing price of the asset over a specific period. Next, determine the deviations of each closing price from the mean. Square each deviation, sum the squared deviations, divide by the number of periods, and finally, take the square root to obtain the standard deviation.
Historical data is essential for this calculation as it provides a basis for gauging how the asset's prices have fluctuated over time. By understanding how to calculate standard deviation, traders can quantify the variation and volatility of the asset.
Higher standard deviation values indicate greater variability, which implies higher risk, while lower values suggest less variability and lower risk. Mastering the calculation of standard deviation is vital for effectively managing risk in trading strategies.
Interpreting Standard Deviation
Interpreting standard deviation involves analyzing the spread of data points around the mean to gauge the level of price variability. By understanding standard deviation, traders can better grasp market volatility, which is essential for managing risk effectively.
Applying standard deviation in trading allows for the identification of potential outliers and the adjustment of strategies to suit prevailing market conditions.
Standard Deviation Basics
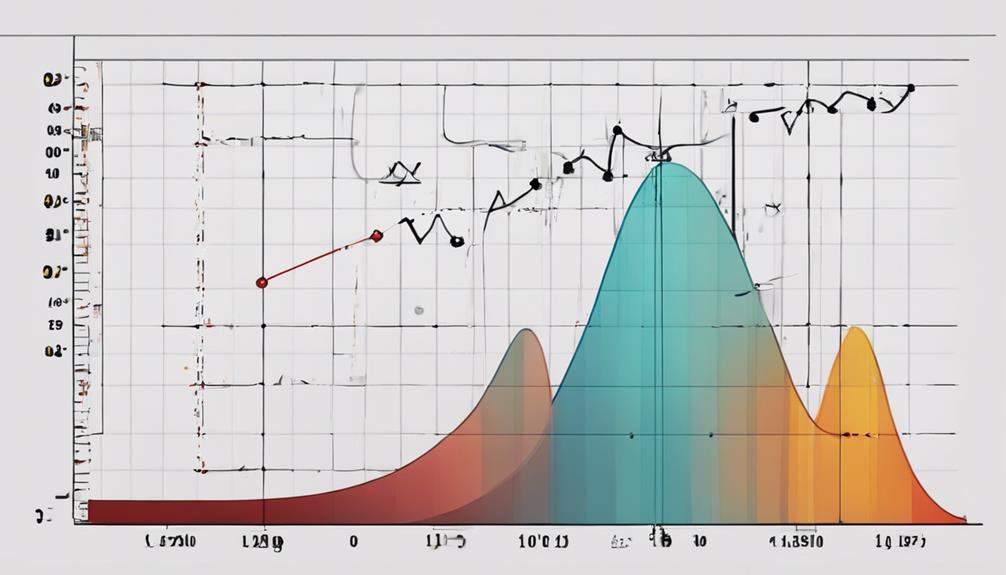
Standard deviation serves as an important statistical metric that measures the dispersion of data points from the mean average, providing valuable insights into the variability of price movements. Understanding standard deviation is key in evaluating market volatility.
Higher standard deviation values indicate greater variability, reflecting more significant price fluctuations and increased market volatility. Conversely, lower standard deviation values suggest less variability, indicating a more stable market environment with smaller price movements.
Traders use standard deviation to analyze and anticipate market uncertainty, enabling them to make informed decisions regarding risk management and trade strategies. By analyzing standard deviation, traders can set realistic profit targets, identify best entry and exit points, and navigate the dynamic nature of the market with greater precision.
Applying SD in Trading
Utilizing standard deviation in trading provides traders with a valuable tool for evaluating market volatility and making informed decisions based on calculated risks and rewards.
- Standard deviation measures dispersion of data points, aiding in evaluating market volatility and risk in trading.
- Understanding standard deviation helps traders set realistic expectations for price movements and identify outliers.
- Traders can use standard deviation to determine entry and exit points based on calculated risks and rewards.
- Bell curves and normal distributions are key to interpreting standard deviation and making informed trading decisions.
These aspects allow traders to adapt their strategies effectively to manage risk in fluctuating market conditions, enhancing their overall trading performance.
Managing Risk Effectively
Effective risk management in trading involves leveraging the insights gained from standard deviation analysis to navigate market volatility with informed decision-making strategies. Traders can employ risk management techniques by interpreting standard deviation to assess the level of market volatility and adjust their positions accordingly. Understanding standard deviation helps in setting appropriate stop-loss orders to mitigate potential losses.
Additionally, standard deviation values can signal overbought or oversold market conditions, prompting traders to contemplate adjustments to their trading strategies. By utilizing standard deviation effectively, traders can adapt to changing market dynamics and enhance their overall risk management approach, ensuring a more calculated and strategic trading experience in the face of market uncertainty.
Managing Risk With Standard Deviation
In risk management strategies for trading, the assessment and management of risk are crucial components that can be facilitated through the use of standard deviation.
- Quantifying Risk: Standard deviation helps traders assess risk by quantifying the dispersion of data points from the mean, providing a measure of market volatility.
- Setting Stop-Loss Orders: Utilizing standard deviation to set stop-loss orders can limit potential losses and safeguard trading positions against adverse price movements.
- Identifying Market Conditions: Standard deviation aids in identifying overbought or oversold market conditions, enabling traders to make more informed decisions.
- Adjusting Strategies: Monitoring standard deviation levels allows traders to adjust their strategies based on calculated risks and changing market volatility, enhancing overall risk assessment.
Common Misconceptions About Standard Deviation

Many misconceptions surround the concept of standard deviation in trading. It is important to clarify that standard deviation does not indicate price movement direction but rather the spread of data points.
Additionally, assuming higher standard deviation always leads to greater returns is a fallacy; it primarily reflects volatility rather than profitability. Understanding these common misconceptions is essential for employing standard deviation effectively in market analysis.
Misunderstanding Standard Deviation
Standard deviation is commonly misconstrued as a measure of absolute value; however, its true function lies in quantifying the dispersion of data points from the mean.
- Higher standard deviation does not always indicate a riskier market; it signifies greater variability in price movements.
- Standard deviation alone cannot predict the direction of price movements; it provides insights into the level of uncertainty.
- Traders misinterpret standard deviation as a fixed value, but it dynamically adjusts based on price fluctuations.
- Relying solely on standard deviation for trading decisions is a misconception; it should be used in conjunction with other indicators for thorough analysis.
Clarifying Misconceptions About SD
Misunderstandings surrounding the interpretation of standard deviation often lead to erroneous assumptions about its role in market analysis and risk assessment. Standard deviation is a statistical measure that quantifies data dispersion, aiding in evaluating volatility and risk rather than predicting future price movements or ensuring profits. It is essential to clarify that a higher standard deviation does not guarantee higher returns, as it does not directly correlate with profitability.
Understanding standard deviation is important for effective risk management strategies and should not be misconstrued as a tool for speculating on future prices. By grasping the true nature of standard deviation and its relationship to volatility and risk, investors can make more informed decisions in dealing with market fluctuations.
Incorporating Standard Deviation Strategies
Utilizing standard deviation strategies in trading involves harnessing historical price data to quantify volatility and evaluate risk levels effectively. When incorporating standard deviation into trading techniques, traders can enhance their decision-making process by:
- Using technical analysis tools like Bollinger Bands that incorporate standard deviation to determine ideal entry and exit points based on market volatility.
- Managing risk more efficiently by adjusting position sizes and setting appropriate stop-loss orders according to standard deviation calculations.
- Gaining insights into market trends and potential price movements by analyzing standard deviation values alongside other indicators.
- Improving trading precision and navigating market volatility more effectively through the implementation of standard deviation strategies.
Tools for Tracking Standard Deviation
Trading platforms equipped with advanced analytical tools offer traders efficient means for tracking market volatility through standard deviation calculations. Standard deviation tools provided by platforms like MetaTrader enable traders to analyze historical volatility trends by calculating the dispersion of price data points around the mean. Additionally, charting software such as TradingView offers visual representations of standard deviation, aiding traders in identifying periods of high or low volatility.
One popular indicator that incorporates standard deviation for volatility tracking is Bollinger Bands. These bands consist of a simple moving average that is accompanied by two standard deviation bands, which expand and contract based on market volatility. By monitoring standard deviation levels through tools like Bollinger Bands, traders can make more informed decisions and adjust their risk management strategies accordingly.
Utilizing Standard Deviation in Trading
Standard deviation serves as a statistical trading edge, allowing traders to gauge market volatility with precision.
By utilizing standard deviation as a tool, traders can measure and manage risks effectively in their trading strategies.
This method enables traders to make calculated decisions based on fluctuations in market prices.
Statistical Trading Edge
The application of statistical measures, such as standard deviation, plays a pivotal role in establishing a trading edge by identifying key points for market entry and exit strategies.
- Standard deviation in trading allows for the assessment of price variability, aiding in the development of effective risk management strategies.
- It provides insights into market volatility by measuring the dispersion of data points from the mean.
- Utilizing standard deviation in trading techniques enhances market analysis and improves risk assessment processes.
- Statistical trading edges are honed by leveraging standard deviation to pinpoint potential entry and exit points in trades, giving traders a competitive advantage in managing market volatility.
Volatility Measurement Tool
Utilizing standard deviation as a metric for evaluating market volatility provides traders with a valuable tool for making informed decisions and implementing effective risk management strategies. Standard deviation quantifies the price variability around the mean in trading, aiding traders in gauging market volatility and setting risk management strategies. A higher standard deviation indicates higher market volatility. By incorporating standard deviation in their analysis, traders can enhance their ability to anticipate price movements and evaluate risks more accurately. This statistical measure is essential for understanding the level of uncertainty or risk in the market, allowing traders to adjust their strategies accordingly.
| Standard Deviation | Market Volatility |
|---|---|
| Quantifies variability | Indicates volatility |
| Helps gauge risk | Aids in decision making |
| Enhances price movement anticipation | Facilitates risk management |
| Key tool in analysis | Essential for informed decisions |
| Evaluates uncertainty | Guides effective risk strategies |
Implementing Trading Strategies
One effective approach to implementing trading strategies involves setting stop-loss and take-profit orders based on calculated standard deviation values. By incorporating standard deviation into trading strategies, traders can better manage risk and optimize their profit potential. Here are four key steps to effectively utilize standard deviation in trading:
- Setting Profit Targets: Utilize standard deviation calculations to identify potential profit targets based on historical price movements and market volatility.
- Adjusting Position Sizes: Use standard deviation values to determine the appropriate position sizes that align with risk tolerance levels and market conditions.
- Enhancing Entry and Exit Points: Identify alternative entry and exit points in trades by considering standard deviation values to improve trading performance.
- Monitoring Market Stability: Regularly monitor standard deviation values to assess market stability and make informed decisions to adjust trading strategies accordingly.
Integrating standard deviation into trading practices enhances risk management capabilities and provides a more thorough analysis of market dynamics, ultimately leading to more effective trading outcomes.
Recognizing Limitations of Standard Deviation

Amidst its utility in risk management and trading optimization, standard deviation presents inherent limitations that must be acknowledged to guarantee a thorough understanding of market dynamics. Standard deviation, relying on historical data, may not always accurately predict future market conditions, particularly during extreme volatility. Market events that fall outside the scope of historical data can greatly impact the accuracy of standard deviation calculations, leading to potential misinterpretations of market behavior.
Additionally, real-time market changes, especially during periods of high volatility, may not be fully captured by standard deviation due to its backward-looking nature. To mitigate these limitations, it is advisable to complement standard deviation analysis with other technical tools and indicators that can provide a more detailed view of market conditions. Recognizing the constraints of standard deviation is important, especially when maneuvering through abnormal or unprecedented market scenarios where traditional statistical measures may fall short in capturing the true essence of market dynamics.
Frequently Asked Questions
How to Get Volatility From Standard Deviation?
Volatility indicators are derived from standard deviation calculations, measuring the dispersion of data points from the mean price to assess market uncertainty.
Traders utilize standard deviation values to gauge price variability, with higher values indicating increased market volatility.
Incorporating standard deviation into risk management strategies allows traders to make informed decisions based on historical price movements, enhancing their ability to navigate market fluctuations effectively.
What Is the Best Trading Strategy for Volatility?
The best trading strategy for volatility involves a thorough understanding of the volatility index. Traders can utilize the volatility index to gauge market volatility levels. Implementing option strategies like straddles or strangles can help capitalize on price movements. Employing effective risk management techniques, such as setting stop-loss orders and position sizing, is essential to mitigate potential losses during volatile market conditions.
These three components work together to create a comprehensive approach to trading in volatile markets.
How to Use Standard Deviations in Trading?
In trading, standard deviations are crucial for calculating correlations, managing risk, and conducting trend analysis. By quantifying price variability, standard deviations provide a statistical framework for evaluating market volatility and making informed trading decisions.
Traders rely on standard deviations to set risk parameters, identify outlier price movements, and adjust their strategies accordingly. Understanding how to utilize standard deviations is essential for optimizing trading performance and maneuvering through dynamic market conditions.
What Strategies Should Be Used When Market View Is Volatile?
During volatile market conditions, effective strategies include:
- Robust risk management to protect against sudden fluctuations.
- Trend-following techniques to capitalize on directional movements.
- Thorough market analysis to make informed decisions.
Maintaining a disciplined approach and sticking to predetermined plans can help mitigate emotional decision-making. Diversification across non-correlated assets can further reduce overall risk exposure.
Combining these elements can enhance trading performance in the face of unpredictability.
Conclusion
To sum up, mastering market volatility through standard deviation trading techniques is essential for effectively managing risk and making informed trading decisions. By understanding and utilizing standard deviation, traders can track market fluctuations, implement strategic trading approaches, and mitigate potential losses.
However, it is important to recognize the limitations of standard deviation in predicting market behavior. As the adage goes, 'measure twice, cut once,' traders should carefully analyze data and trends before executing trades to maximize success in volatile markets.