
Understanding standard deviation in stocks is crucial for evaluating volatility and risk. It measures how stock prices vary around their average, indicating potential price movements. High standard deviation signifies more volatility and risk, while low standard deviation suggests stability. Investors can use this metric to align their investment strategies with their risk tolerance levels. Calculating standard deviation involves analyzing market volatility and making informed decisions on risk-return tradeoffs. If you're looking to deepen your knowledge on this topic, further exploration will enhance your understanding of how standard deviation impacts stock investments.
What Is Standard Deviation?
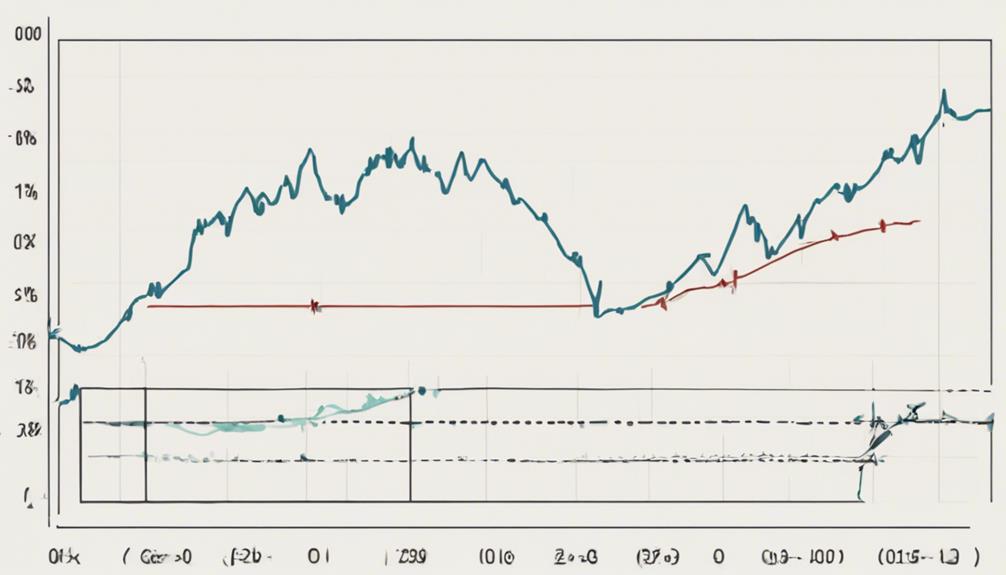
In the domain of stock market analysis, the concept of standard deviation serves as a fundamental metric for gauging the dispersion of stock prices around their average value. Standard deviation in stocks is a statistical measure that helps assess the volatility and risk associated with a particular stock. It provides investors with valuable insights into the potential price movements of a stock. A high standard deviation indicates that the stock's prices are spread out over a wider range, suggesting higher volatility and greater risk. Conversely, a low standard deviation signifies that the stock's prices are closer to the mean, indicating more stability and lower risk.
Calculating standard deviation involves taking the square root of the variance, which is the average of the squared differences between each data point and the mean. This process helps investors evaluate market volatility and make informed decisions about the risk-return tradeoff of investing in a particular stock. By understanding standard deviation, investors can better quantify and manage the risks associated with their investment portfolios.

Importance of Standard Deviation
An essential aspect of stock market analysis lies in recognizing the significance of standard deviation as a pivotal metric for evaluating volatility and risk within stock prices. Standard deviation plays a vital role in helping investors understand the potential risks and rewards associated with different stocks.
- Measuring Volatility: Standard deviation helps measure the volatility of stock prices, indicating how much they fluctuate from their average value.
- Assessing Risk: Understanding standard deviation provides insights into the level of risk involved in stock investments, helping investors make more informed decisions.
- Predicting Returns: By analyzing standard deviation, investors can assess the potential range of returns or losses on their stock investments, aiding in setting realistic expectations.
- Risk and Reward: Higher standard deviation signifies higher risk and potential reward in stock investments, allowing investors to align their investment strategies with their risk tolerance and financial goals.
Calculating Standard Deviation

Understanding the intricacies of stock price fluctuations necessitates a focused exploration into the methodology of calculating standard deviation. Standard deviation in stocks is a key metric that quantifies the dispersion of stock prices around the mean.
By evaluating standard deviation, investors gain insights into the volatility and risk associated with a particular stock. The process involves determining the average price, appraising price deviations from this average, and analyzing the spread of price movements.
This analysis is essential for evaluating market risk and making informed investment decisions.
Relationship With Stock Volatility
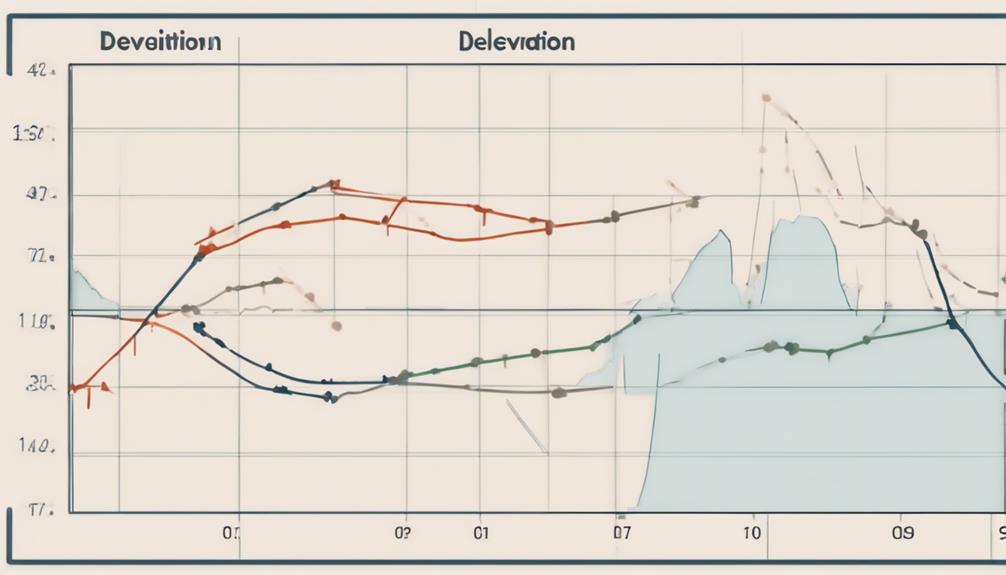
How does standard deviation in stocks correlate with stock volatility, and what implications does this relationship have for investors? Standard deviation, as a measure of dispersion of stock prices around the average, plays a significant role in understanding stock volatility and risk. Here's how this relationship impacts investors:
- Higher Standard Deviation Indicates Higher Stock Volatility: Stocks with high standard deviation are more volatile, indicating greater price fluctuations and increased risk for investors.
- Understanding Price Movements: Standard deviation helps investors grasp the potential range of price movements, providing insights into the potential risks associated with investing in a particular stock.
- Predictability of Stock Prices: By analyzing standard deviation, investors can assess the stability and predictability of stock prices, enabling them to make more informed decisions.
- Informed Decision-Making: Investors use standard deviation to gauge the level of risk they are comfortable with, allowing them to make informed investment decisions aligned with their risk tolerance and financial goals.
Interpreting Standard Deviation
Interpreting standard deviation in stocks provides investors with valuable insights into the level of volatility and risk associated with different investment options. Standard deviation measures the dispersion of stock prices around the mean. When the standard deviation is high, it indicates that stock prices are more spread out from the average, signaling greater volatility and risk. On the other hand, a low standard deviation suggests that stock prices are closer to the mean, reflecting more stable and predictable behavior.
Investors utilize standard deviation to assess the risk levels of various stocks in their portfolios. By understanding the standard deviation of different stocks, investors can make informed decisions when choosing between conservative and aggressive investments. Stocks with higher standard deviations are generally considered riskier, as their prices can fluctuate significantly. Conversely, stocks with lower standard deviations are perceived as less risky due to their more consistent price movements. Therefore, interpreting standard deviation is pivotal for investors aiming to manage and optimize their investment portfolios effectively.
Standard Deviation Vs Risk
High standard deviation in stocks is closely associated with increased price volatility and risk. When evaluating the relationship between standard deviation and risk in the stock market, the following points should be considered:
- Volatility: Stocks with high standard deviation exhibit more significant price fluctuations, indicating higher volatility. This can lead to potential large gains but also substantial losses.
- Risk Evaluation: Standard deviation is an important tool for evaluating the level of risk in stock investments. It helps investors understand the potential variability in returns and the likelihood of experiencing losses.
- Stability: Conversely, stocks with low standard deviation are considered less risky as they demonstrate more stable and predictable price movements. This stability may appeal to investors seeking consistent returns over time.
- Return Potential: Understanding standard deviation allows investors to gauge the potential range of returns. Higher standard deviation implies a wider range of possible outcomes, while lower standard deviation suggests more consistent returns.
Standard Deviation in Investment Analysis
Utilizing standard deviation in investment analysis provides an essential framework for evaluating the volatility and risk associated with stock prices. Standard deviation measures the spread of stock returns from their average, offering insights into potential price fluctuations. Investors rely on standard deviation to assess the stability and predictability of stock movements. High standard deviation signifies higher risk, indicating the potential for significant price variations. By comparing the standard deviations of different stocks, investors can make informed decisions aligned with their risk tolerance levels.
| Standard Deviation | Significance |
|---|---|
| High | Indicates higher risk and potential for significant price variations |
| Low | Suggests lower risk and more stable price movements |
| Comparing | Enables informed decisions based on risk tolerance levels |
Standard Deviation in Portfolio Management
Standard deviation in portfolio management serves as an essential tool for evaluating the risk and volatility associated with an investment portfolio. It provides valuable insights into the potential fluctuations in returns, helping investors make informed decisions.
- Risk Assessment: Standard deviation helps measure the dispersion of returns around the portfolio's average return, giving a clear picture of the portfolio's risk exposure.
- Diversification Strategy: Understanding standard deviation is vital for diversifying a portfolio effectively. By spreading investments across different assets with uncorrelated price movements, investors can manage risk.
- Expected Returns: Portfolio managers use standard deviation to estimate the expected range of returns. Lower standard deviation indicates more stable returns, while higher standard deviation implies higher risk and potential for greater returns.
- Informed Decisions: By analyzing standard deviation, investors can make informed investment decisions based on their risk tolerance and return objectives, ultimately optimizing their portfolio's performance.
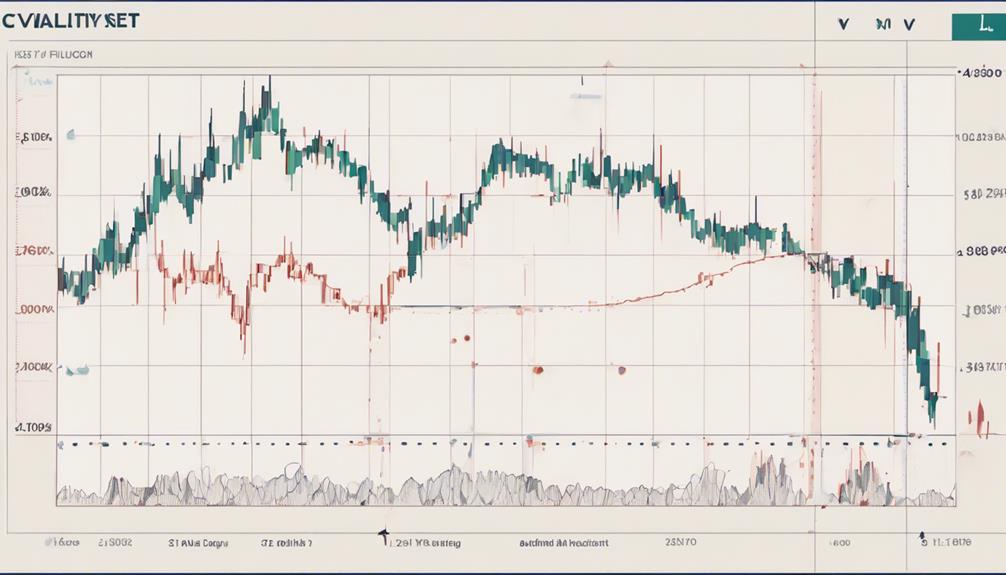
Standard Deviation in Stock Market
An essential metric for evaluating the risk and volatility of individual stocks in the financial markets is standard deviation. Standard deviation in the stock market is a measure of the dispersion of a stock's price from its average price. It provides investors with insights into the potential price fluctuations and risk associated with a particular stock.
Implied volatility, which reflects potential stock price movements away from the current price, influences standard deviation. Stocks with higher implied volatility tend to have a wider range of outcomes, leading to a higher standard deviation. For instance, for a $100 stock with 20% implied volatility, one standard deviation would range from $80 to $120.
This information is important for options traders who use standard deviation to assess the probabilities of strikes expiring in or out of the money. High implied volatility increases the range of probabilities and strike selection in options trading, making standard deviation a valuable tool for managing risk and making informed investment decisions.
Standard Deviation Vs Variance
How do standard deviation and variance differ in measuring data spread and risk evaluation in investments?
Variance quantifies the dispersion of data points from the mean in a data set, while standard deviation provides an essential measure of this data spread by taking the square root of the variance.
When it comes to evaluating risk in investments, standard deviation is a vital metric that helps investors understand the volatility of stock prices and assess potential returns or losses. On the other hand, variance highlights the overall variability present in the data set.
Calculating both variance and standard deviation allows investors to gauge the level of risk associated with a stock accurately. Understanding the relationship between these two statistical measures is essential for investors to make informed decisions based on the dispersion of stock prices from the mean and accurately assess potential risk and return trade-offs.
Standard Deviation and Risk Tolerance
Investors' risk tolerance levels can be effectively aligned with their investment decisions through a thorough understanding of standard deviation in relation to stock price volatility. Standard deviation serves as an important metric for evaluating the potential risks and volatility of stocks based on their historical price movements.
By evaluating standard deviation, investors can gauge the price variability of a stock; higher standard deviation indicates increased risk and fluctuation, while lower deviation suggests more stable price movements. This information empowers investors to compare the volatility of different stocks and make informed decisions that align with their risk appetite.
Standard deviation provides a quantitative measure of how much a stock's price may deviate from its average value, aiding investors in assessing the potential risks associated with a particular investment. By leveraging standard deviation analysis, investors can make well-informed decisions that match their risk tolerance levels and investment objectives.
Standard Deviation for Informed Investing

Standard deviation analysis provides investors with a quantitative measure of stock price dispersion from the average, offering valuable insights into potential volatility and risk. When considering standard deviation for informed investing, the following points are essential in understanding its significance:
- Stock Price Volatility: Standard deviation helps investors gauge the volatility of a stock's price movements, indicating the potential range within which the stock price may fluctuate.
- Risk Assessment: High standard deviation in stocks suggests greater risk due to the wider price fluctuations, helping investors assess the level of risk associated with a particular investment.
- Informed Investment Decisions: Investors use standard deviation to make well-informed decisions by understanding the historical volatility of a stock, enabling them to anticipate potential price movements and make strategic investment choices.
- Market Behavior Insights: Standard deviation serves as a key metric in risk assessment, providing insights into price variability and market behavior, assisting investors in maneuvering through the uncertainties of the stock market.
Practical Applications of Standard Deviation
Standard deviation plays an important role in evaluating the risk and volatility of individual stocks, assisting investors in making informed decisions. By understanding standard deviation, investors can gauge the potential range of outcomes and adjust their strategies accordingly.
Implied volatility influences standard deviation ranges, impacting options trading and risk management in the stock market.
Risk Assessment Using SD
Quantifying the volatility and risk associated with stocks through the utilization of standard deviation is a fundamental aspect of risk assessment in financial markets.
When it comes to risk assessment using standard deviation:
- Volatility Measurement: Standard deviation helps measure the spread of stock prices, indicating the level of volatility.
- Risk Evaluation: High standard deviation signifies riskier stocks with unpredictable price movements, while low standard deviation implies more stability.
- Risk Tolerance Analysis: Investors use standard deviation to assess potential losses and align their risk tolerance with their investment decisions.
- Risk Management Strategy: Standard deviation aids in evaluating the risk-adjusted performance of stocks, assisting in the development of effective risk management strategies and the construction of a diversified investment portfolio.
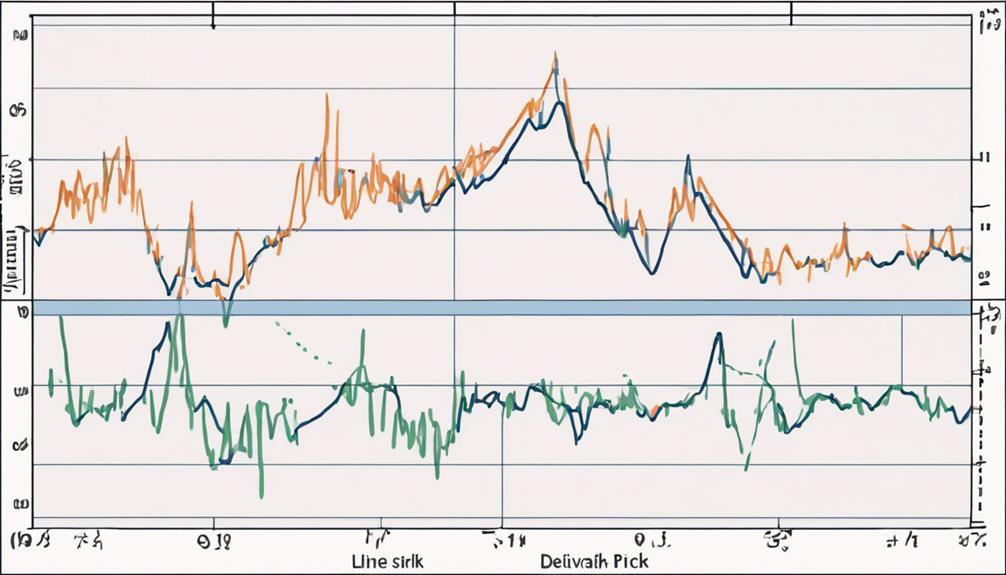
Volatility in Stock Market
When evaluating volatility in the stock market, understanding standard deviation plays a vital role in analyzing potential price movements and risk in financial instruments. Implied volatility in stocks indicates the potential price movement away from the stock price, with higher implied volatility signaling a wider standard deviation range around the stock price. In options trading, strategies heavily rely on standard deviation for gauging probabilities of in-the-money or out-of-the-money outcomes. Standard deviation also aids in selecting appropriate strike prices based on implied volatility levels. Understanding standard deviation ranges is essential for evaluating the risk and potential outcomes in options trading effectively.
| Keywords | Description |
|---|---|
| Implied Volatility | Reflects potential price movement away from stock price. |
| Options Trading | Relies on standard deviation for gauging probabilities of outcomes. |
| Strike Prices | Chosen based on standard deviation and implied volatility for options trading. |
| Probability Calculations | Standard deviation assists in probability evaluations for options trading. |
Frequently Asked Questions
How Do You Interpret Standard Deviation of a Stock?
Interpreting the standard deviation of a stock involves analyzing historical data to gauge the volatility of its returns, an essential risk assessment factor for investors. This statistical analysis utilizes the standard deviation as a measure of how far the stock returns deviate from their average.
Understanding this concept aids in evaluating market fluctuations, forming an informed investment strategy, and assuming a normal distribution pattern for potential returns.
What Is the Easiest Way to Understand Standard Deviation?
Understanding standard deviation can be simplified by relating it to the concept of variability. In the real world, think of standard deviation as a measure of how spread out data points are from the average.
It's an essential tool in risk assessment and volatility measurement within investments. By analyzing historical data and using mathematical formulas, investors can develop investment strategies based on the expected price ranges derived from standard deviation.
What Is a Good Standard Deviation for a Stock Portfolio?
A good standard deviation for a stock portfolio typically falls within the range of 10% to 20%. This range is indicative of moderate risk and potential return in a diversified portfolio. Investors evaluate risk tolerance, historical data, and market conditions to determine an appropriate standard deviation.
Balancing diversification benefits and volatility measurement is essential in shaping an effective investment strategy. Understanding standard deviation aids in portfolio management for optimizing risk-return profiles in varying market scenarios.
How Much Standard Deviation Is Acceptable in Stock?
When evaluating the acceptable standard deviation in stocks, investors should consider their risk tolerance, market volatility, historical data, investment strategy, portfolio diversification, risk assessment, and statistical analysis.
A favorable standard deviation aligns with an investor's risk profile and investment objectives. Understanding the implications of different standard deviation levels can aid in making informed decisions regarding portfolio construction and risk management.
This analytical approach guarantees a balanced investment approach tailored to individual preferences and goals.
Conclusion
In summary, as the saying goes, 'knowledge is power.' Understanding standard deviation in stocks is essential for informed investing decisions.
By calculating and interpreting this measure of dispersion, investors can assess the volatility and risk associated with a particular stock.
Utilizing standard deviation alongside other financial metrics can help investors make more informed choices, aligning with their risk tolerance and investment goals.
Ultimately, mastering standard deviation is key to maneuvering through the complexities of the stock market with confidence and precision.
