
Market volatility indicators like ADX, ATR, and Bollinger Bands are crucial for evaluating risk and making informed trading decisions. ADX assesses trend strength, ATR measures price range and volatility, while Bollinger Bands indicate price direction. Adapting strategies to market conditions based on these indicators optimizes risk management and enhances trading effectiveness. By combining volatility indicators with trending indicators, traders can navigate volatile market phases more effectively, leading to improved decision-making and profitability. Understanding how to use these indicators can greatly enhance your trading strategy.
Understanding Market Volatility Indicators
When delving into the domain of market volatility indicators, a vital understanding of these tools is essential for informed decision-making in trading strategies.
Trading in financial markets inherently involves risk, and market volatility indicators play a pivotal role in evaluating and managing this risk.
These indicators provide valuable insights into the price fluctuations and volatility levels within the market, enabling traders to make well-informed decisions about their trading positions and strategies.
Importance of ADX Indicator
The ADX indicator plays a vital role in evaluating trend strength by analyzing price highs and lows. Traders rely on ADX values crossing specific thresholds to signal potential trend beginnings.
Incorporating the ADX indicator into trading strategies enhances decision-making by providing insights into trend strength and aiding in adapting to market volatility.
ADX Indicator Basics
Utilizing the ADX indicator in trading strategies provides traders with a valuable tool for evaluating trend strength and making informed decisions in the market. By analyzing price highs and lows, the ADX indicator helps identify the presence of a new trend, signaling potential trading opportunities.
Traders rely on the ADX crossing above key levels like 20 or 25 to confirm the strength of a trend before executing trading decisions. Understanding the ADX indicator basics is essential for adjusting trading strategies to align with the identified trend strength.
Incorporating the ADX indicator into trading approaches can lead to more informed decision-making processes and potentially enhance overall trading performance significantly.
Interpreting ADX Values
Interpreting ADX values is essential for traders seeking to gauge trend strength and make well-informed decisions in the market. The Average Directional Index (ADX) measures the strength of a trend by analyzing price highs and lows.
When ADX values cross above 20 or 25, it often signifies the start of a new trend, whether bullish or bearish. Traders rely on ADX to confirm the presence of a trending market and evaluate the trend's intensity.
A rising ADX indicates a strengthening trend, while a declining ADX suggests weakening momentum. By understanding ADX values, traders can adjust their strategies to better navigate and capitalize on trending market conditions efficiently.
ADX in Trend Analysis
An essential tool for traders analyzing market trends, the Average Directional Index (ADX) serves as a reliable indicator of trend strength based on price fluctuations.
- The ADX indicator measures trend strength by analyzing price highs and lows, aiding in identifying the robustness of a trend.
- Crossing above 20 or 25 levels on the ADX signifies the commencement of a new trend, providing valuable guidance on potential entry or exit points.
- Utilizing the ADX helps traders validate strong trends and mitigate false signals, particularly in volatile market conditions.
- When combined with other indicators, the ADX offers a holistic view of market trends, assisting in spotting potential trading opportunities effectively.
Utilizing ATR for Price Range Measurement
ATR, or Average True Range, serves as an essential tool for measuring price range and volatility in trading. By considering the high, low, and previous close prices, ATR provides traders with valuable insights into the potential price movements of an asset.
Understanding ATR values allows traders to make informed decisions regarding stop-loss levels, position sizes, and overall trading strategies.
ATR for Volatility Measurement
Utilizing the Average True Range (ATR) metric for price range measurement provides traders with valuable insights into market volatility dynamics.
- ATR calculates the true range of price bars, considering gaps and limit moves, to gauge the extent of potential price fluctuations.
- Higher ATR values indicate increased market volatility, while lower values suggest reduced volatility levels.
- Traders use ATR to set effective stop-loss levels, helping them manage risk during volatile market conditions.
- ATR assists in determining most suitable position sizes based on the current market volatility, enabling traders to adapt their strategies accordingly.
Price Range Calculation
Price range calculation, facilitated by the Average True Range (ATR) metric, offers traders a reliable method to assess market volatility dynamics and make informed trading decisions. ATR calculates the true range of price bars, providing insight into potential price movement and market volatility. By analyzing ATR values, traders can determine the potential price range for an asset, aiding in risk management and setting appropriate stop-loss levels.
Understanding ATR values enhances traders' ability to adjust trading strategies according to the market's volatility levels. Incorporating ATR into trading strategies allows traders to anticipate price fluctuations effectively and make well-informed decisions to optimize their trading approach.
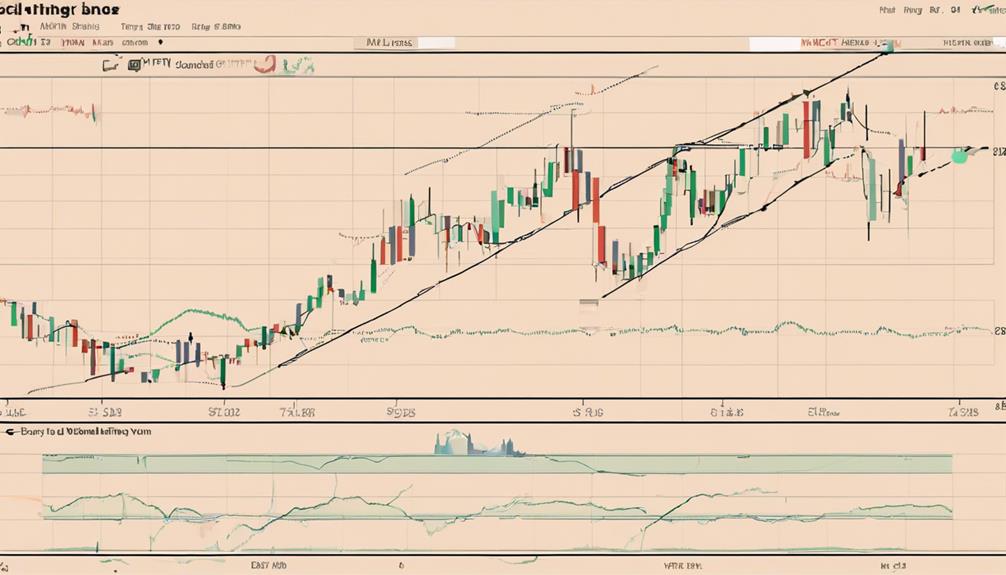
Bollinger Bands for Price Direction
Bollinger Bands, a technical analysis tool comprising an upper band, a lower band, and a simple moving average, offer valuable insights into price volatility and direction.
- The upper and lower bands expand and contract based on price volatility, providing visual cues for potential price reversals or breakouts.
- Identifying overbought and oversold conditions is possible with Bollinger Bands, assisting traders in determining entry and exit points in the market.
- When prices touch the upper band, it may signal an overbought condition, while touching the lower band may indicate an oversold condition.
- Traders utilize Bollinger Bands to assess market volatility, anticipate trend changes, and develop effective trading strategies based on price direction.
Adapting Strategies to Market Conditions
Adapting trading strategies to changing market conditions is essential for success in volatile environments. By adjusting strategies based on market conditions, traders can optimize risk management and capitalize on potential opportunities.
Utilizing a flexible approach that aligns with current market dynamics enhances the effectiveness of trading decisions.
Market Condition Adjustments
In the world of active trading, aligning strategies with prevailing market conditions is a pivotal factor in enhancing performance and mitigating risks.
- Adapting trading strategies based on high or low volatility levels improves the effectiveness of the trading strategy.
- Utilizing volatility indicators like Bollinger Bands and Average True Range (ATR) aids in identifying excellent entry and exit points.
- Adjusting risk management techniques in response to changing market conditions is essential for protecting capital.
- Fine-tuning position sizing according to the current volatility environment helps in managing risk and maximizing profitability.
Strategic Flexibility Essential
Given the dynamic nature of market conditions, the ability to adjust trading strategies in response to evolving volatility indicators is a fundamental aspect of maintaining competitiveness and optimizing performance. Strategic flexibility is essential for traders to adapt their approaches to changing market dynamics effectively. This adaptability enables them to manage risks, make timely decisions, and optimize trading strategies based on market indicators. By monitoring volatility indicators and understanding their impact on trading strategies, traders can enhance their overall performance. Flexibility in strategy execution allows for a more agile response to market fluctuations, leading to improved outcomes. Incorporating risk management practices when adjusting strategies guarantees a balanced approach to dealing with volatile market conditions.
| Key Aspects | Description |
|---|---|
| Strategic Flexibility | Ability to adjust trading strategies based on evolving market conditions |
| Risk Management | Implementing practices to mitigate risks when adapting strategies to volatility |
| Market Indicators | Monitoring signals to make informed decisions and optimize trading strategies |
| Timely Decisions | Making quick and well-informed choices in response to changing market dynamics |
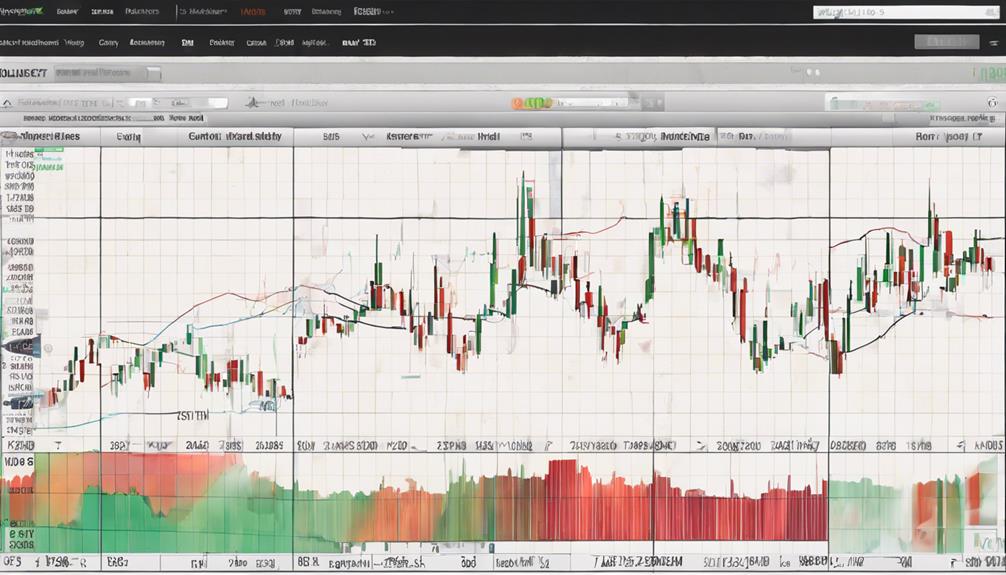
Identifying Market Transitions With Indicators
Utilizing a combination of volatility and trend indicators can offer valuable insights for identifying market shifts effectively in trading strategies. When looking to identify market transformations, traders can rely on various indicators to enhance their decision-making process:
- ADX Indicator: Measures trend strength using price highs and lows, with levels crossing 20 or 25 signaling the beginning of a trend.
- ATR (Average True Range): Calculates the true range of price bars, providing insights into market volatility levels.
- Bollinger Bands: Display price volatility and direction, aiding traders in adapting strategies to changing market conditions.
- Volatility Indicators: Techniques like the Bollinger Band squeeze can be potent tools for recognizing market transformations efficiently.
Enhancing Trading Decisions With Volatility
When considering market shifts and effective trading strategies, incorporating volatility indicators plays a pivotal role in enhancing decision-making processes and adapting to dynamic market conditions.
Volatility indicators such as the VIX and ATR help traders gauge market expectations and measure price range volatility. Understanding these indicators can assist in identifying potential breakouts or reversals, allowing traders to make informed trading decisions.
By incorporating volatility indicators in trading strategies, traders can effectively adapt to changing market conditions and capitalize on market movements with greater precision. These indicators also provide valuable insights into market sentiment, guiding traders in setting appropriate stop-loss levels for risk management.
Ultimately, utilizing volatility indicators in trading can lead to improved decision-making, better risk management, and increased profitability by leveraging the opportunities presented by market volatility.
Combining Volatility With Trending Indicators

Enhancing trend identification and confirmation can be achieved by combining volatility indicators like Bollinger Bands with trending indicators. When these tools are used together, traders can gain valuable insights into the market dynamics during periods of high volatility. Here are key points to keep in mind:
- Bollinger Bands and ADX Intersection: The convergence of Bollinger Bands and the Average Directional Index (ADX) can indicate potential breakout opportunities in trending markets with increased volatility.
- ADX for Trend Strength: ADX, when paired with volatility indicators, helps traders assess the strength of a trend, especially in volatile conditions.
- ATR for True Range: Integrating the Average True Range (ATR) with volatility indicators offers a deeper understanding of price movements and overall market volatility levels.
- Comprehensive Strategy Development: By combining volatility indicators with trending indicators, traders can develop a robust strategy to navigate volatile market phases effectively, improving decision-making processes and overall trading performance.
This strategic approach can help traders capitalize on market volatility while staying informed about trend developments.
Improving Trading Effectiveness
To enhance trading effectiveness, incorporating key volatility indicators such as ADX, ATR, and Bollinger Bands is essential for evaluating trend strength, price range accuracy, and market volatility levels. Traders rely on these indicators to assess the intensity of market trends and potential breakout points.
The Average Directional Index (ADX) crossing the 20 or 25 levels can signal the start of a trend, providing valuable guidance for trading decisions. ATR (Average True Range) helps in determining the true price range, enabling traders to set appropriate stop-loss levels and position sizes based on the underlying market volatility.
Bollinger Bands, on the other hand, not only indicate price volatility but also offer insights into potential breakout or reversal points. By utilizing these volatility indicators, traders can adapt their strategies to varying market conditions, leading to improved trading effectiveness through informed decision-making and enhanced market analysis.
Experimenting with these common volatility indicators on charting platforms can further refine trading approaches.
Capitalizing on Market Movements

Effective utilization of market volatility indicators is crucial for traders seeking to capitalize on dynamic market movements and optimize their trading strategies. By incorporating indicators such as Bollinger Bands and Average True Range (ATR) into their analysis, traders can enhance their understanding of market volatility and make more informed decisions. Here are some key ways traders can capitalize on market movements:
- Utilize Bollinger Bands to identify periods of high and low volatility, helping determine best entry and exit points for trades.
- Use ATR to gauge the level of market volatility and adjust risk management strategies accordingly to protect against potential losses.
- Implement a combination of volatility indicators to develop a thorough trading strategy that adapts to changing market conditions.
- By effectively interpreting market volatility indicators, traders can increase the likelihood of making profitable trading decisions and achieving their financial goals.
Incorporating these indicators into trading strategies can lead to more successful and sustainable trading outcomes.
Frequently Asked Questions
How Do You Use Volatility Indicator in Trading?
Volatility analysis in trading involves utilizing indicators like Average True Range (ATR) and Bollinger Bands to assess market volatility levels.
These indicators generate trading signals by identifying volatility spikes that influence price movement. Traders incorporate risk management strategies based on these indicators to navigate market trends effectively.
Employing technical analysis with volatility indicators aids in making informed trading decisions aligned with market conditions.
What Is the Best Trading Strategy for Volatility?
In managing market volatility, the best trading strategy involves a balanced approach that integrates risk management, technical analysis, and option strategies.
By closely monitoring the volatility index, market trends, and trading signals, traders can optimize profit potential.
Incorporating multiple indicators and tools enhances decision-making in volatile conditions, ensuring adaptability and resilience.
A prudent strategy includes a mix of proactive risk mitigation measures and strategic positioning to capitalize on market fluctuations efficiently.
How Do You Benefit From Market Volatility?
Market volatility presents opportunities for traders to benefit from price fluctuations. By effectively managing risks and capitalizing on profit potential, traders can navigate market trends and optimize trade execution. Timing entries, adjusting stops, and proper position sizing are essential in harnessing the advantages of market volatility.
Understanding these dynamics allows traders to make informed decisions and enhance their trading strategies for improved outcomes.
How to Trade Volatility Indices Successfully?
To trade volatility indices successfully, traders must focus on:
- Risk management
- Anticipating volatility spikes
- Capitalizing on trading opportunities
- Analyzing historical data
- Employing technical analysis
- Monitoring market trends
- Adjusting position sizing accordingly
Conclusion
To summarize, utilizing market volatility indicators can enhance trading strategies by providing valuable insights into price movements. By incorporating indicators such as ADX, ATR, and Bollinger Bands, traders can adapt their strategies to changing market conditions and make more informed decisions.
Combining volatility indicators with trending indicators can improve trading effectiveness and capitalize on market movements. Embracing volatility as a tool for success is essential for achieving profitable outcomes in the financial markets.