
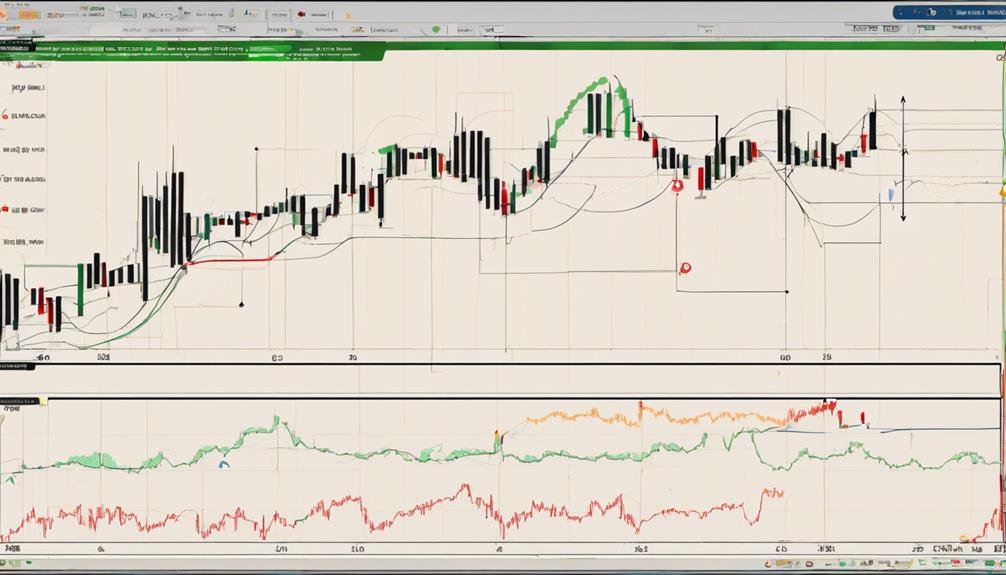
The MACD crossover strategy operates by analyzing the intersection of the MACD line with the signal line to determine buy and sell signals, assisting traders in pinpointing ideal entry and exit points based on the prevailing trend direction and momentum. By closely monitoring these crossovers, traders can capitalize on potential shifts in market dynamics and enhance their overall trading performance. This strategy offers a systematic approach to maneuvering market trends and filtering out false signals, ultimately aiding traders in making well-informed decisions for improved trade outcomes. Mastering this strategy can lead to significant gains in the trading arena.
MACD Crossover Strategy Explained
In understanding the MACD Crossover Strategy, one must grasp the significance of the MACD line crossing above the signal line as a key indicator for initiating buy positions in trading scenarios.
The MACD, short for Moving Average Convergence/Divergence, is a widely used technical analysis tool that helps traders identify potential trend changes. The crossover between the MACD line and the signal line is pivotal as it signifies shifts in momentum and potential buy signals.

The signal line, often a 9-day exponential moving average, plays an important role in generating these buy and sell signals. Traders rely on this strategy to determine entry and exit points in the market by interpreting the relationship between these lines.
Successful execution of the MACD crossover strategy can lead to significant gains, but incorrect timing may result in losses. Therefore, understanding the dynamics of this strategy and mastering the interpretation of crossover signals is essential for traders aiming to capitalize on market movements effectively.
Identifying Bullish Crossover Signals

Identifying bullish crossover signals involves understanding the basic concept of when the MACD line surpasses the signal line. Traders often rely on confirmation methods like observing the MACD histogram bars changing from negative to positive.
Timing entry points accurately is vital when capitalizing on bullish crossovers to benefit from potential uptrends in the financial markets.
Bullish Crossover Basics
When the MACD line crosses above the signal line, a bullish crossover is generated, indicating a potential uptrend and signaling a buying opportunity in the market. This event is pivotal for trend-following traders who utilize the MACD crossover strategy to confirm bullish momentum and consider opening long positions.
By accurately identifying these bullish crossovers, traders can capitalize on subsequent price movements to maximize profits. Understanding the basics of bullish crossovers is vital for traders looking to align themselves with the market's upward momentum and strategically enter positions that align with the potential uptrend.
This technical analysis tool serves as a valuable indicator for interpreting market sentiment and making informed trading decisions.
Signal Confirmation Methods
A key method for confirming signal accuracy in bullish crossovers involves evaluating the MACD line's position relative to the signal line and monitoring the trend strength through rising values above the zero line.
When the MACD line crosses above the signal line, it generates a bullish crossover signal indicating a potential upward trend and a buying opportunity. Traders often seek confirmation by observing increasing histogram bars post-crossover, as this signifies growing bullish momentum.
Timing Entry Points
Utilizing the MACD crossover strategy involves strategically timing entry points by observing the intersection of the MACD line with the signal line. When identifying bullish crossover signals, traders focus on the MACD line crossing above the signal line, signaling potential upward momentum.
To capitalize on this strategy effectively, traders should consider the following:
- The MACD crossover can indicate ideal buying opportunities.
- Bullish crossover signals suggest a potential uptrend in stock prices.
- Monitoring the relationship between the MACD line and the signal line is essential for making informed trading decisions.
- Timing entry points using the MACD crossover strategy can help traders align their positions with potential market upswings.
Recognizing Bearish Crossover Patterns
When observing bearish MACD crossover patterns, traders pay close attention to the MACD line crossing below the signal line. This indicates a potential shift in market sentiment. This pattern serves as a signal for traders to contemplate selling or closing out long positions as the momentum weakens, suggesting a forthcoming downward trend.
It is vital for traders to confirm this bearish crossover with complementary technical indicators to enhance the accuracy of their trading decisions.
Bearish MACD Signal
The identification of a bearish MACD signal hinges on the precise moment when the MACD line crosses below the signal line on the chart. This bearish signal suggests a potential shift in momentum towards a downtrend, signaling traders to contemplate selling their positions as the uptrend weakens.
To recognize a bearish MACD signal effectively, traders should pay attention to the following:
- MACD Line Crossing Below Signal Line: The primary indicator of a bearish signal.
- Weakening Uptrend: Signifies a potential reversal in the current bullish momentum.
- Contemplate Selling Positions: Traders often interpret the bearish crossover as a prompt to sell.
- Monitoring MACD Histogram: Look for confirmation through negative bars in the histogram to reinforce the bearish signal.
Timing Exit Strategy
To effectively navigate the bearish crossover patterns and strategically time exit points, traders must keenly observe the interaction between the MACD line and the signal line for potential shifts in market momentum. A bearish crossover in the MACD strategy occurs when the MACD line crosses below the signal line, indicating a possible trend reversal to the downside. Recognizing these bearish crossovers is essential for implementing an exit strategy to manage risk effectively. By identifying these patterns, traders can protect profits or capitalize on downside momentum by adjusting their positions accordingly. Utilizing bearish crossovers as part of the MACD strategy enhances risk management practices in trading.
| Aspect | Description |
|---|---|
| Signal for Exit | MACD line crosses below the signal line |
| Market Direction | Indicates potential trend reversal to the downside |
| Risk Management | Helps in managing risk effectively by recognizing bearish signals |
| Position Adjustment | Allows for adjusting positions to protect profits or capitalize on downside momentum |
| Strategy Enhancement | Integrating bearish crossovers in the MACD strategy for improved risk management and exit planning |
Using MACD as Entry and Exit
Implementing the MACD crossover strategy effectively hinges on precise timing and disciplined execution. When using MACD as an entry and exit tool, traders can follow these steps to enhance their decision-making and improve trade success:
- Confirming Trend Direction: Utilize the MACD crossover to confirm the trend direction in the market before entering or exiting a trade.
- Filtering False Signals: The MACD crossover strategy can help filter out false signals by waiting for a confirmed crossover of the MACD line over the signal line.
- Assessing Momentum and Reversals: Employ divergence analysis with the MACD crossover to assess momentum in the market and identify potential trend reversals.
- Utilizing Other Indicators: Combine the MACD crossover strategy with other technical indicators to enhance decision-making and validate trade signals effectively. By incorporating additional indicators, traders can gain a more thorough view of the market and make informed trading decisions.
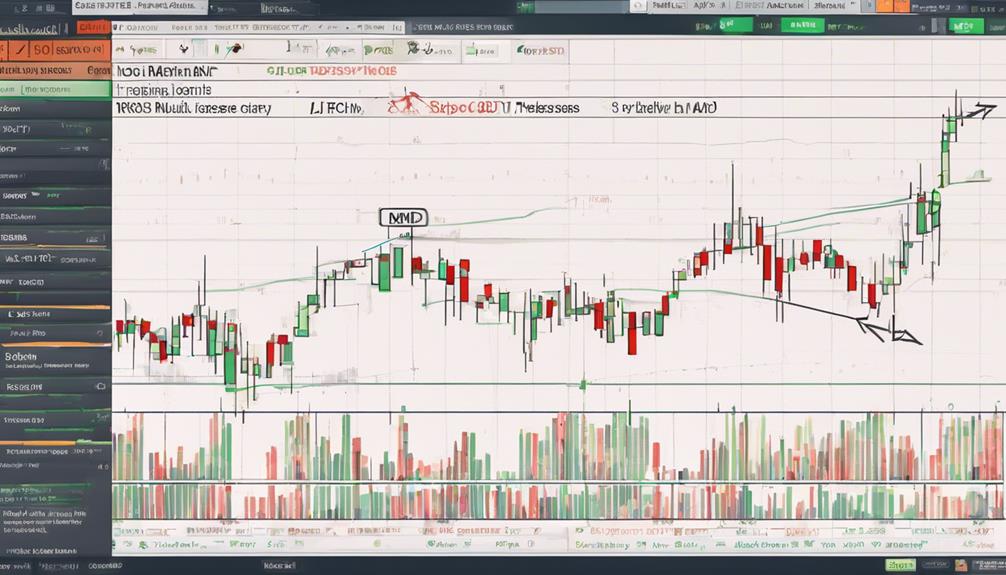
Practical Application of Crossover Strategy
In practical application, traders can leverage the MACD crossover strategy to identify opportune moments for entering or exiting trades based on momentum shifts and trend confirmations. The MACD crossover strategy involves monitoring the relationship between the MACD lines and the trigger line to generate buy and sell decisions. When the MACD line crosses above the trigger line, it signals a bullish trend, indicating a potential buying opportunity. Conversely, a crossover where the MACD line crosses below the trigger line suggests a bearish trend, signaling a potential selling opportunity. By interpreting these crossovers, traders can effectively utilize the MACD as a trend-following momentum indicator to capitalize on price momentum and anticipate trend reversals in the market.
Implementing the MACD crossover strategy requires a disciplined trading style and a thorough understanding of how to interpret MACD signals accurately. Traders need to take into account the significance of crossovers in the context of their overall trading strategies and remain vigilant for potential signals that may influence their buy or sell decisions. By integrating MACD strategies into their trading approach, investors can enhance their ability to make informed decisions and optimize their trading performance.
Benefits of MACD Crossover Method
Utilizing the MACD crossover method in trading provides traders with a systematic approach to identifying and capitalizing on potential trend changes in the market. This method relies on the MACD line crossing over the signal line to generate buy or sell signals, offering traders valuable insights into market dynamics. Here are four key benefits of incorporating the MACD crossover strategy into trading decisions:
- Clear Buy and Sell Signals: The MACD crossover method helps traders pinpoint precise entry and exit points by signaling potential trend reversals.
- Confirmation of Trend Direction: Traders can use the MACD crossover strategy to confirm the direction of a trend, aiding in making informed trading decisions.
- Noise Filtering: This strategy is effective in filtering out market noise, allowing traders to focus on significant price movements and trends.
- Enhanced Entry and Exit Points: By using the MACD crossover method, traders can enhance their timing for entering and exiting trades, potentially improving overall profitability.
Real-Time Examples of Crossover Trades

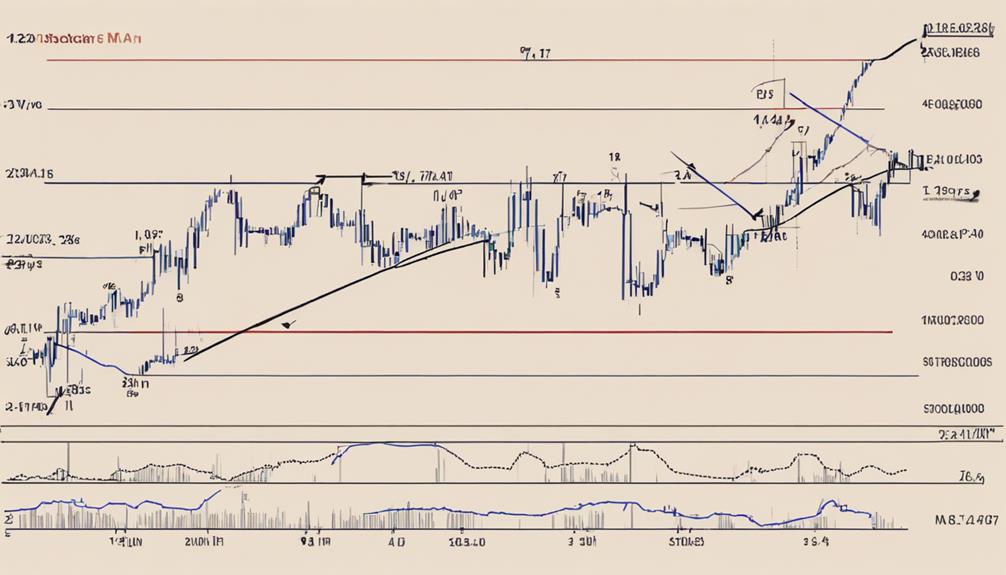
Examining real-time instances of crossover trades provides practical insights into the application and effectiveness of the MACD crossover strategy in live trading environments. In bullish scenarios, a bullish MACD crossover is observed when the MACD line crosses above the signal line, indicating a potential uptrend. Conversely, a bearish MACD crossover, signaling a possible downtrend, occurs when the MACD line crosses below the signal line. Traders often seek confirmation from other indicators or price action before acting on MACD crossovers to avoid false signals. It is important to note that the MACD crossover strategy is most effective in trending markets where crossovers can offer reliable buy or sell signals. Monitoring MACD crossovers on various timeframes allows traders to identify trading opportunities with varying levels of significance.
| MACD Crossover Type | Description |
|---|---|
| Bullish | MACD line above signal line, uptrend potential |
| Bearish | MACD line below signal line, possible downtrend |
| Confirmation | Use of other indicators or price action for validation |
| Trending Markets | Best environment for reliable signals |
Enhancing Trading Precision With MACD
Enhancing trading precision with MACD involves leveraging the crossover signals generated by the MACD line crossing the signal line to refine entry and exit points in the market. Traders can enhance their trading accuracy by considering the following:
- Confirmation of Trend Changes: The MACD crossover strategy provides a reliable method to confirm potential trend changes in the market, aiding traders in adjusting their positions accordingly.
- Identification of Entry and Exit Points: By analyzing the MACD line crossing the signal line, traders can pinpoint ideal entry and exit points, improving the timing of their trades.
- Utilizing Buy or Sell Signals: The MACD crossover strategy offers clear buy or sell signals when the MACD line crosses above or below the signal line, assisting traders in making informed trading decisions.
- Capitalizing on Market Momentum Shifts: Monitoring the MACD line relative to the signal line enables traders to capitalize on market momentum shifts, enhancing overall trading precision.
Improving Trading Performance With MACD
Improving trading performance with MACD involves strategically integrating the MACD crossover signals to optimize trading decisions and maximize profitability.
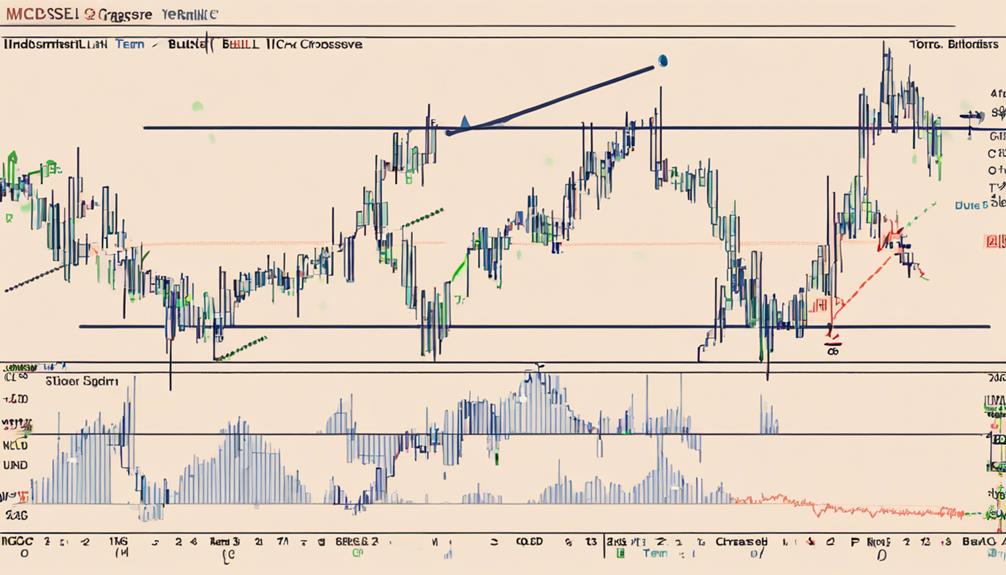
By utilizing the MACD histogram, traders can visualize the price difference between the MACD and signal lines, aiding in identifying potential market movements.
Zero crosses on the MACD indicate new uptrends or downtrends forming when the exponential moving averages cross the zero line, offering valuable insights into trend changes.
Additionally, combining the MACD crossover strategy with indicators like the Relative Vigor Index (RVI) and Money Flow Index (MFI) can help confirm trend momentum and strength, enhancing the effectiveness of trading signals.
This strategy is particularly useful for providing clear entry and exit signals in trading, making it a valuable tool for traders seeking to improve their trading performance.
Frequently Asked Questions
How to Use MACD Crossover?
To utilize the MACD crossover effectively, traders can identify entry points by monitoring the MACD line crossing the signal line. This crossover can confirm trends and guide trade execution based on price action.
However, it's important to implement risk management strategies due to market volatility and potential false signals. Utilizing moving averages and backtesting results can enhance the accuracy of the strategy, leading to more informed trading decisions.
What Is the Success Rate of MACD Crossover Strategy?
The success rate of the MACD crossover strategy hinges on historical performance, backtesting results, and adept risk management in varying market conditions.
The strategy's efficacy relies on generating trade signals with a favorable risk-reward ratio, necessitating portfolio diversification, volatility analysis, precise position sizing, and strategic entry points.
What Is the Best Timeframe for MACD Crossover?
Determining the ideal timeframe for MACD crossovers is essential for traders to maximize the strategy's effectiveness. This decision should be informed by backtesting results, risk management considerations, and the trader's ability to identify trends accurately.
Factors like market volatility, entry and exit signals, and the ability to avoid false signals are essential in selecting the right timeframe. Filtering out noise and adjusting parameters accordingly are key to refining the strategy.
How Accurate Is a MACD Crossover?
The accuracy of a MACD crossover strategy is influenced by various factors, including historical data, market conditions, volatility analysis, and price patterns.
Evaluating statistical significance through backtesting results is essential in determining the reliability of trading signals. Traders must also consider risk management, trend identification, and best indicator settings to enhance accuracy.
Conclusion
To sum up, the MACD crossover strategy is a powerful tool for identifying potential trend reversals and generating buy or sell signals in the market.
By utilizing the MACD indicator to analyze moving averages and price momentum, traders can make more informed decisions and improve their trading performance.
Like a skilled navigator using a compass to navigate stormy seas, the MACD crossover strategy can guide traders through the turbulent waters of the financial markets with precision and accuracy.
