
Mastering Ichimoku for trading success requires understanding its components, like Tenkan-Sen and Kijun-Sen lines, pivotal for trend analysis. Trend identification involves utilizing these lines, drawing support/resistance trend lines, and monitoring crossings for market sentiment. Entry and exit points are indicated by Tenkan Sen crossing Kijun Sen and Kumo cloud signals. Efficient risk management entails stop-loss orders within the cloud, identifying support/resistance levels, and confirming signals with indicators. Practical application includes strategies like Kumo Breakout and Tenkan-Kijun Crossover. Implementing these techniques enhances trading efficiency.Understanding Ichimoku Components, Trend Identification, and Entry/Exit Points are essential for successful trading.
Understanding Ichimoku Components
In dissecting the intricate framework of the Ichimoku Indicator, it is imperative to grasp the fundamental components that collectively shape its analytical prowess.
The Tenkan-Sen, known as the Conversion Line, plays an essential role in identifying the short-term trend direction by averaging the highest high and lowest low over the past nine periods.

On the other hand, the Kijun-Sen, or the Base Line, determines the medium-term trend strength through a similar averaging process over the past 26 periods.
The Chikou Span, referred to as the Lagging Span, aids in identifying trend reversals by plotting the closing price of the current period shifted back 26 periods.
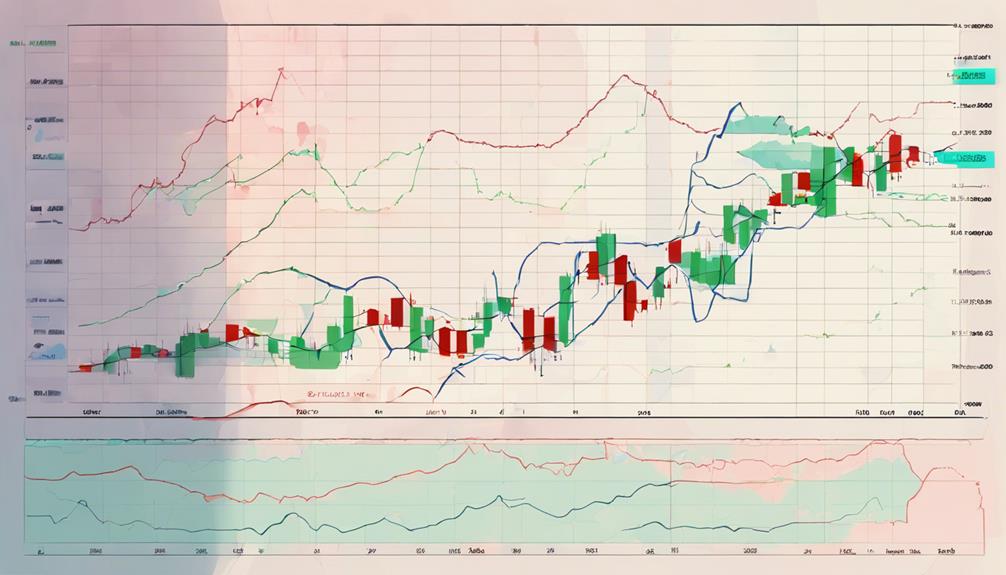
Additionally, the Senkou Span A and Senkou Span B collaborate to form the Kumo Cloud, providing future price movement projections based on a specific time frame calculation.
Understanding these components is pivotal in utilizing the Ichimoku Indicator effectively for trend analysis and trading decisions.
Implementing Trend Identification
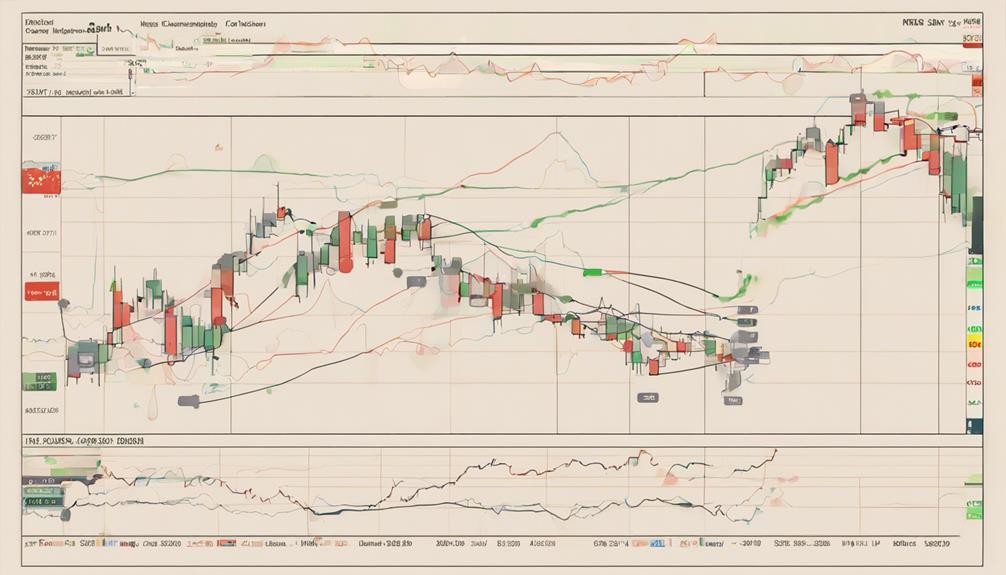
Utilizing the Tenkan Sen and Kijun Sen lines within the Ichimoku Indicator is paramount for effectively implementing trend identification in trading strategies. These lines help traders identify trend direction by crossing over or under each other, signaling potential entry points.
Drawing trend lines at support and resistance levels can further confirm the trend direction indicated by the Tenkan Sen and Kijun Sen lines. By following the uptrend indicated by the lines, traders can watch for BUY signals, while in a downtrend, SELL signals may be more prevalent.
Monitoring the crossing of these lines on different timeframes can also provide insights into trend strength. This analysis allows traders to gauge the market sentiment, potentially predicting price movements accurately.
Mastering Entry and Exit Points
Efficiently mastering entry and exit points is essential for maximizing trading success when utilizing the Ichimoku indicator. When considering entry and exit points while trading with the Ichimoku Cloud, the following strategies can be helpful:
- Utilize the Tenkan Sen crossing above the Kijun Sen line as a signal for entry points.
- Pay attention to the Kumo cloud area above the price chart for potential buy signals during a crossing.
- Monitor trend reversal signs, such as the crossing of the Tenkan Sen and Kijun Sen lines again, to determine exit points effectively.
Additionally, incorporating stop-loss orders within the Kumo cloud can aid in managing risks efficiently. The Chikou Span line's position in relation to past price action can further confirm entry and exit points.
Risk Management Strategies
Effective risk management strategies play a pivotal role in enhancing trading precision and safeguarding capital when utilizing the Ichimoku Cloud indicator. Setting stop-loss orders within the Ichimoku Cloud is important for managing risk and limiting potential losses.
Identifying support and resistance levels using this indicator not only enhances trading precision but also aids in making informed decisions. It is essential to confirm signals with additional indicators like RSI and MACD to reduce the risk of false trading signals.
Maintaining a balance between risk and reward through disciplined risk management practices is essential for successful trading with the Ichimoku Cloud. Additionally, the dynamic support and resistance levels provided by the Ichimoku Cloud contribute to trading efficiency and improve overall risk management.
Practical Application of Ichimoku
The practical application of the Ichimoku Cloud indicator in trading involves implementing various strategies based on its components to generate valuable trading signals. Traders can capitalize on the indicator's features to navigate market trends effectively.
Here are three key strategies for utilizing the Ichimoku Cloud indicator:
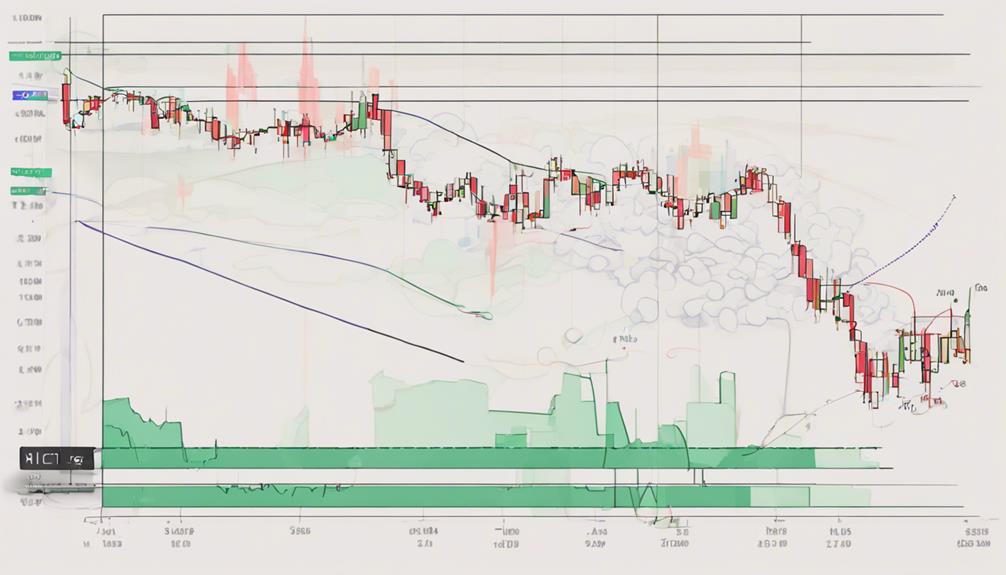
- Kumo Breakout: This strategy involves entering a trade when the price breaks above or below the Kumo cloud, indicating a potential trend reversal or continuation.
- Tenkan-Kijun Crossover: Traders watch for the Tenkan Sen line crossing above or below the Kijun Sen line, signaling a shift in momentum and potential entry/exit points.
- Kumo Twist: The Kumo Twist occurs when Senkou Span A and B switch positions, indicating a change in market sentiment and offering insights into trend reversals.
Frequently Asked Questions
What Is the Best Indicator to Use With Ichimoku?
When considering the best indicator to use with Ichimoku, traders often look to:
- RSI divergence
- Moving averages
- Fibonacci retracement
- Bollinger bands
- MACD crossover
- Volume analysis
- Support resistance
- Candlestick patterns
- Trend following
- Price action
Each of these indicators can complement Ichimoku by providing additional confirmation signals or insights into market dynamics. It is essential to test and adapt these indicators to suit individual trading strategies and objectives effectively.
What Is the Success Rate of Ichimoku Indicator?
The success rate of the Ichimoku indicator is dependent on its accuracy in generating trading signals across various market conditions. Historical performance, backtesting results, trend identification, and pattern recognition contribute to evaluating its effectiveness.
Traders must consider risk management, profit potential, and volatility analysis while utilizing the indicator. Continuous evaluation and refinement of trading strategies can enhance the success rate of Ichimoku in generating profitable opportunities.
What Is the Best Timeframe for Ichimoku?
Timeframe selection for Ichimoku trading involves aligning trading strategies with the desired level of precision and confirmation. Shorter timeframes like 1-hour can offer more frequent entry signals but may be prone to noise.
Longer timeframes such as daily charts provide more reliable signals but require patience for trend development. Traders must consider factors like volatility, risk management, and market conditions when selecting the best timeframe to optimize their Ichimoku trading success.
What Are the 5 Lines of Ichimoku?
The five lines of the Ichimoku indicator are vital components for understanding price movement.
Tenkan Sen and Kijun Sen indicate trend direction and support/resistance levels.
Chikou Span reflects past closes aiding trend reversal identification.
Senkou Span A and Senkou Span B create the cloud, projecting future price areas.
Each line has a specific role in the interpretation and analysis of market trends, providing signals for entry/exit points and overall market assessment.
Conclusion
To sum up, mastering the Ichimoku indicator involves:
- Understanding its components,
- Identifying trends,
- Determining entry and exit points,
- Implementing risk management strategies, and
- Applying it practically in trading.
By following a step-by-step approach, traders can increase their chances of success in the market.
Through diligent study and practice, one can harness the power of Ichimoku to make informed trading decisions and achieve profitable outcomes.
