
Mastering Fibonacci Extensions involves understanding critical percentage-based levels like 61.8%, 100%, 161.8%, etc., crucial in predicting price movements and managing risk in trading. Traders utilize Fibonacci extensions for setting profit targets and identifying potential reversal zones strategically. By grasping the core mathematical principles and applying them in various market conditions, one can enhance their trading proficiency. Exploring the historical effectiveness of Fibonacci extensions across different assets and experimenting with diverse extension levels can help adapt strategies based on market volatility. Developing a systematic approach to integrating Fibonacci extensions into trading strategies guarantees consistency and precision in decision-making.
Fibonacci Extensions Basics
In the domain of technical analysis, the fundamental underpinning of Fibonacci extensions lies in their representation as percentage-based levels, such as 61.8%, 100%, 161.8%, 200%, and 261.8%. These extensions play an essential role in predicting potential price movements and identifying reversal points in trading scenarios. Traders utilize Fibonacci extensions to set strategic stop-loss levels, a vital aspect of risk management strategies. By understanding the relationships between these extension levels and price movements, traders can make informed decisions about where to place stop-loss orders to limit potential losses.
The use of Fibonacci extensions in technical analysis involves selecting key points on a price chart and drawing extensions at specific percentage levels. While there is no fixed formula for creating Fibonacci extensions, traders typically multiply the difference between points by desired ratios and then add or subtract this amount to/from the third point to determine target extension levels. This methodical approach aids traders in setting price targets and managing risks effectively within their trading strategies.

Drawing Fibonacci Extensions
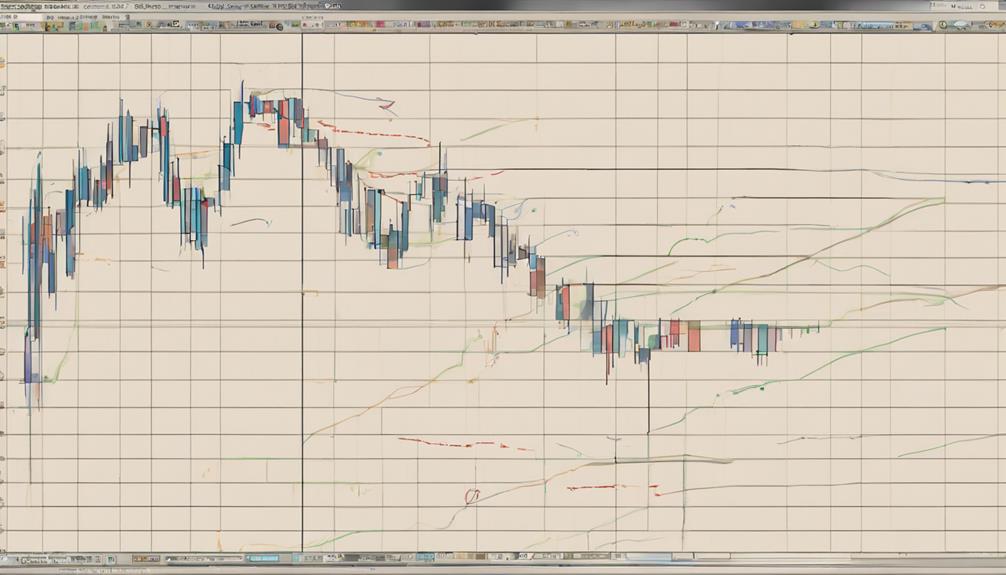
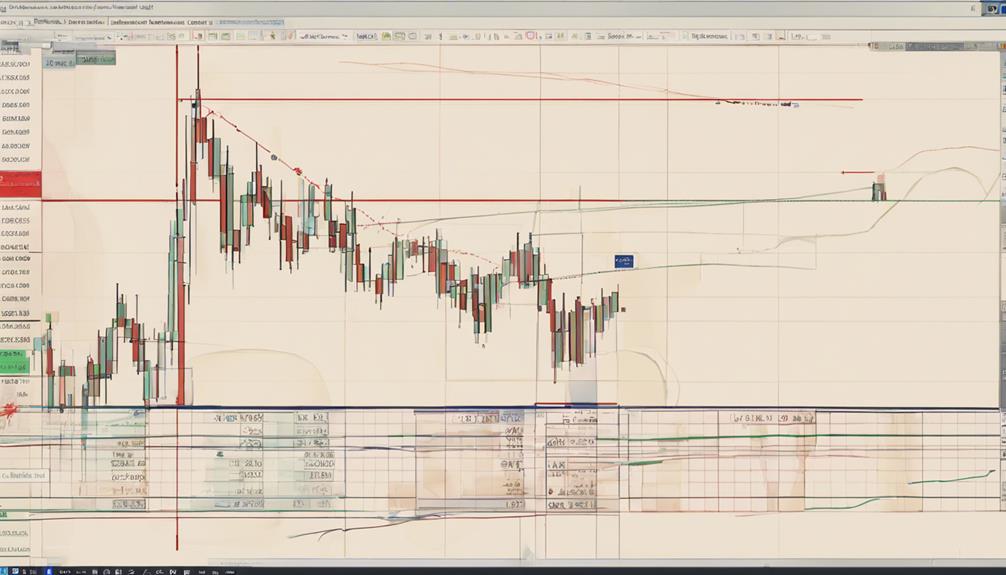
Utilizing Fibonacci extensions involves strategically plotting horizontal lines on a price chart to pinpoint potential reversal or target levels. Traders draw Fibonacci extensions at specific percentage levels like 61.8%, 100%, 161.8%, and beyond, based on key points selected on the chart.
By visualizing these extensions, traders can identify important price targets and potential reversal zones for making strategic decisions. These levels provide valuable insights for setting profit targets and determining stop-loss levels to manage risk effectively.
Through chart analysis, traders can utilize Fibonacci extensions as a tool to enhance their trading strategies and improve their overall performance. The process of drawing Fibonacci extensions is essential for traders seeking to incorporate technical analysis into their trading decisions, allowing them to make informed choices based on historical price movements and key Fibonacci levels.
Calculating Fibonacci Extension Levels
Fibonacci extension levels are essential in trading. They are computed by multiplying the difference between two points by specific ratios. These ratios, such as 1.618 or 2.618, are then added or subtracted from the third point to determine potential price targets.
Extension Level Calculation Methods
By employing specific ratios and the difference between two price points, traders can accurately calculate Fibonacci extension levels for strategic price target setting. These levels play an essential role in identifying potential reversal zones and profit-taking points within trading strategies. Traders often use Fibonacci extensions alongside other technical tools to enhance risk management and trade optimization. Understanding the application of Fibonacci extensions is key to making informed trading decisions across various financial markets.
| Fibonacci Extension Levels | Description |
|---|---|
| 1.618 | Common extension ratio |
| 2.618 | Key extension level |
| 3.618 | Advanced extension ratio |
| 4.236 | High-probability level |
| 5.618 | Extreme extension level |
Fibonacci Retracement as Basis
Drawing on the foundational principles of Fibonacci retracement levels, the calculation of Fibonacci extension levels in trading hinges on strategic application of key ratios to project potential price targets. Traders utilize the difference between significant points in price movement and apply ratios such as 1.618 and 2.618 to determine potential extension levels.
These Fibonacci extensions, indicated on price charts, help identify areas where price reversal or continuation may occur. By understanding the relationship between retracements and extensions, traders can effectively set profit targets and manage risk.
This methodical approach to Fibonacci extension levels provides traders with a structured framework for analyzing price movements and making informed trading decisions based on projected extension targets.
Applying Extension Ratios
Building upon the foundational principles of Fibonacci retracement levels, the process of calculating Fibonacci extension levels involves strategic application of key ratios to forecast potential price targets with precision. Fibonacci extension ratios such as 61.8%, 100%, 161.8%, 200%, and 261.8% are commonly used to determine these levels.
By multiplying the difference between points by the desired ratio, traders can predict future price movements and establish target prices. Incorporating Fibonacci extensions into trading strategies also aids in setting effective stop-loss levels for risk management. Traders often place stop-loss levels slightly below the extension level to mitigate potential losses.
Price Targets and Reversal Zones
Identifying precise price targets and recognizing key reversal zones is essential in leveraging Fibonacci extensions for strategic trading decisions. Fibonacci extensions, represented as percentage levels like 61.8%, 100%, 161.8%, 200%, and 261.8% on a price chart, help traders identify potential price targets and pinpoint areas where significant price action may occur. By calculating Fibonacci levels using ratios such as 1.618 and 2.618, traders can make accurate projections for market movements. To assist in risk management, traders can utilize Fibonacci extensions by setting stop-loss levels based on these extension levels to limit potential losses. The table below illustrates how Fibonacci extensions can aid traders in identifying price targets and reversal zones effectively:
| Fibonacci Level | Key Features |
|---|---|
| 61.8% | Common retracement level |
| 100% | Potential reversal zone |
| 161.8% | Extension level for price targets |
Fibonacci Extensions in Risk Management
Utilizing Fibonacci extensions in risk management enables traders to strategically set stop-loss levels based on calculated extension distances, effectively mitigating potential losses in trading scenarios. By incorporating Fibonacci extensions into risk management strategies, traders can establish predefined levels where they will exit a trade if the market moves against them. This approach helps traders protect their capital and manage risk effectively.
Furthermore, combining Fibonacci extensions with other technical analysis tools can provide confirmation signals for trade decisions. The use of Fibonacci extensions across various financial markets allows traders to identify price targets and potential reversal zones accurately. Particularly in analyzing impulse waves, Fibonacci extensions play an important role in projecting future price levels after a retracement.
Understanding the distinction between Fibonacci extensions and retracements is essential for traders to make informed decisions in the market. This knowledge empowers traders to implement precise risk management strategies and enhance their overall trading performance.
Stop-Loss Strategies With Fibonacci
Incorporating Fibonacci extensions into stop-loss strategies in trading enhances risk management practices by strategically placing orders below key extension levels to limit potential losses. By setting stop-loss levels slightly below these Fibonacci extension levels, traders aim to protect their capital and manage risk effectively. This approach also aids in establishing clear risk-reward ratios, as stop-loss orders based on Fibonacci extensions help define the potential loss in relation to the expected gain.
Moreover, combining Fibonacci extensions with stop-loss strategies serves as an essential exit strategy when the market moves against a trader's position. This method not only helps in preserving capital but also contributes to trade efficiency by providing predefined points at which to exit a trade. Utilizing Fibonacci extensions for stop-loss placement is a proactive approach that adds structure to trading decisions, ensuring that risk is controlled and losses are minimized, ultimately leading to a more disciplined and successful trading experience.
Combining Fibonacci With Indicators
Integrating Fibonacci analysis with technical indicators such as moving averages and RSI can greatly enhance the precision and depth of trading strategies by offering supplementary confirmation for ideal entry and exit points. By combining Fibonacci levels with indicators, traders can validate key support and resistance levels more accurately, leading to more informed decision-making. This synergy between Fibonacci and indicators like MACD provides thorough insights into potential market movements, improving the overall quality of analysis.
The use of indicators alongside Fibonacci not only adds a layer of confirmation but also increases the robustness of trading strategies. This combination allows traders to have increased confidence in their decisions, as they are supported by multiple technical tools working in harmony. By leveraging the strengths of both Fibonacci analysis and technical indicators, traders can create a more comprehensive approach to analyzing market dynamics, ultimately leading to more effective trading strategies and improved outcomes in the market.
Fibonacci Fan and Channel Analysis
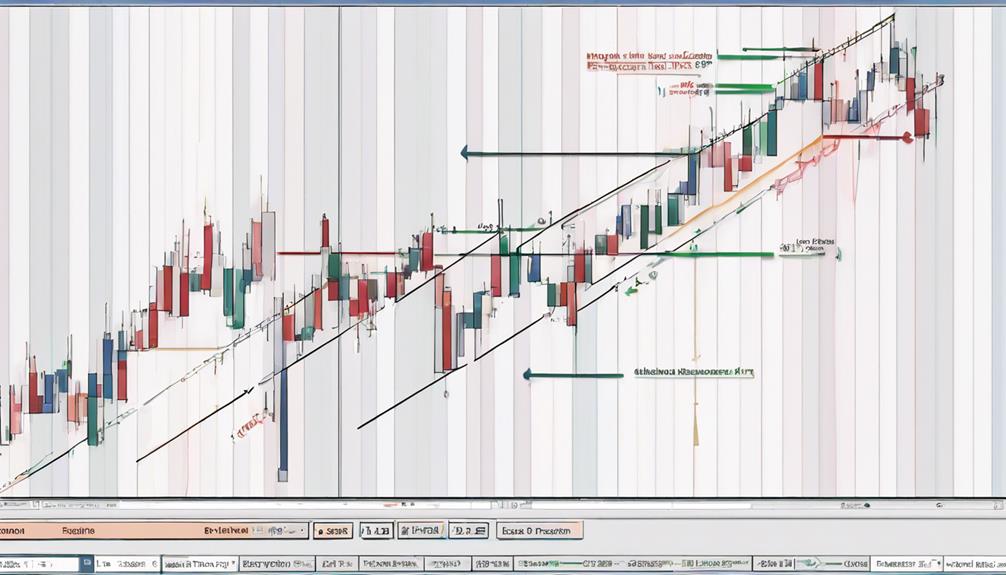
The Fibonacci Fan tool aids in identifying potential support and resistance trendlines based on key Fibonacci levels.
The Fibonacci Channel tool helps analyze parallel support and resistance lines to predict price movements.
These tools serve as essential elements in technical analysis, offering traders visual cues for recognizing trends.
Fan Tool Basics
Utilizing the Fibonacci Fan tool in technical analysis allows traders to pinpoint trendlines based on key Fibonacci levels such as 38.2%, 50%, and 61.8%. This aids in the visualization of potential support and resistance levels by projecting diagonal trendlines from significant price points. These trendlines help traders identify areas where the price may find support or face resistance, assisting in making informed trading decisions.
Additionally, Fibonacci Channel analysis involves drawing parallel lines alongside the trendline to establish potential price channels within which the price may fluctuate. Mastering the basics of Fibonacci Fan and Channel tools enhances traders' technical analysis capabilities, providing a structured approach to analyzing price movements and identifying potential trading opportunities.
Channel Application Tips
Connecting key price points through Fibonacci Fan and Channel analysis provides traders with valuable insights into potential trendlines and price channels, aiding in strategic decision-making within the financial markets.
By utilizing Fibonacci Fan, traders can identify trendlines that help visualize potential price movements and trend reversals.
On the other hand, Fibonacci Channel involves analyzing parallel support and resistance lines based on Fibonacci levels, enhancing the accuracy of technical analysis in making trading decisions.
Understanding how to draw and interpret Fibonacci Fan and Channel is essential for improving trading strategies, as it allows traders to better anticipate market behavior and adjust their positions accordingly.
Incorporating these tools into one's technical analysis toolkit can provide a significant advantage in navigating the complexities of the financial markets.
Fibonacci Time Zones Forecasting
Analyzing market trends through Fibonacci Time Zones forecasting provides traders with a strategic approach to anticipate potential time-based reversals. Fibonacci Time Zones, based on Fibonacci ratios, help identify key time periods for potential price movements and market reversals.
Key Fibonacci Time Zones include 0.382, 0.500, 0.618, 1.000, and 1.618, which are vital levels for forecasting. By integrating Fibonacci Time Zones with price analysis, traders can refine the timing of their entries and exits in the market.
Understanding these time zones offers valuable insights into the cyclical nature of price movements, enabling traders to make more informed decisions. By utilizing Fibonacci Time Zones effectively, traders can enhance their overall trading strategy and improve their ability to predict market behavior.
This forecasting tool adds a time dimension to traditional Fibonacci analysis, providing a detailed approach to analyzing and predicting market movements.
Fibonacci Strategies in Trading
Fibonacci strategies in trading leverage mathematical ratios to forecast price targets and potential reversal zones, enhancing traders' decision-making processes. When utilizing Fibonacci extensions, traders project price targets following a retracement, focusing on impulse waves in trading. These extensions are typically represented as percentage-based levels such as 61.8%, 100%, 161.8%, 200%, and 261.8%.
By incorporating Fibonacci extensions, traders can set stop-loss levels based on the distance between the entry point and the extension level, aiding in risk management. Moreover, Fibonacci extensions play an important role in identifying potential price targets and reversal zones across various financial markets, including stocks, Forex, and cryptocurrencies.
Understanding the distinction between Fibonacci extensions and retracements is essential for implementing effective technical analysis strategies and improving decision-making processes in trading scenarios. By integrating Fibonacci strategies into their trading approach, traders can gain insights into price movements and optimize their trading outcomes.
Fibonacci Trading Examples
Fibonacci Trading Examples provide practical illustrations of how traders can apply Fibonacci extensions in real-life trading scenarios. By showcasing actual trades that utilize these extensions, traders can gain insights into how to identify entry and exit points effectively.
These examples offer tangible demonstrations of the strategic use of Fibonacci levels to enhance decision-making processes in trading.
Real-Life Fibonacci Trades
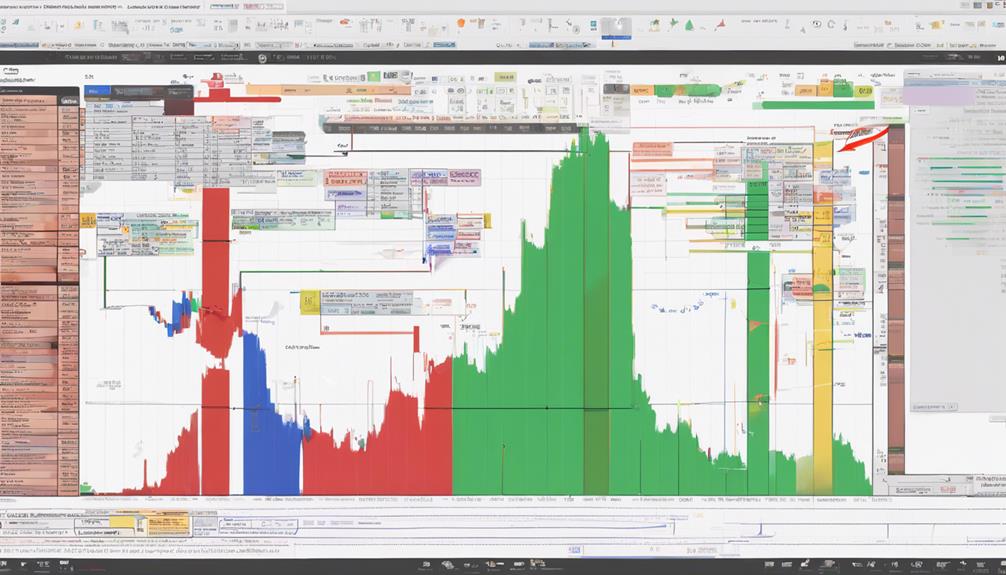
Real-life trading examples vividly demonstrate the practical application of Fibonacci extensions in various market scenarios.
- Traders utilize Fibonacci levels to set precise profit targets and effectively manage risk.
- By studying real-life trades, traders can identify potential reversal points for strategic decision-making.
- Understanding entry and exit levels based on Fibonacci extensions enhances traders' ability to capitalize on market movements.
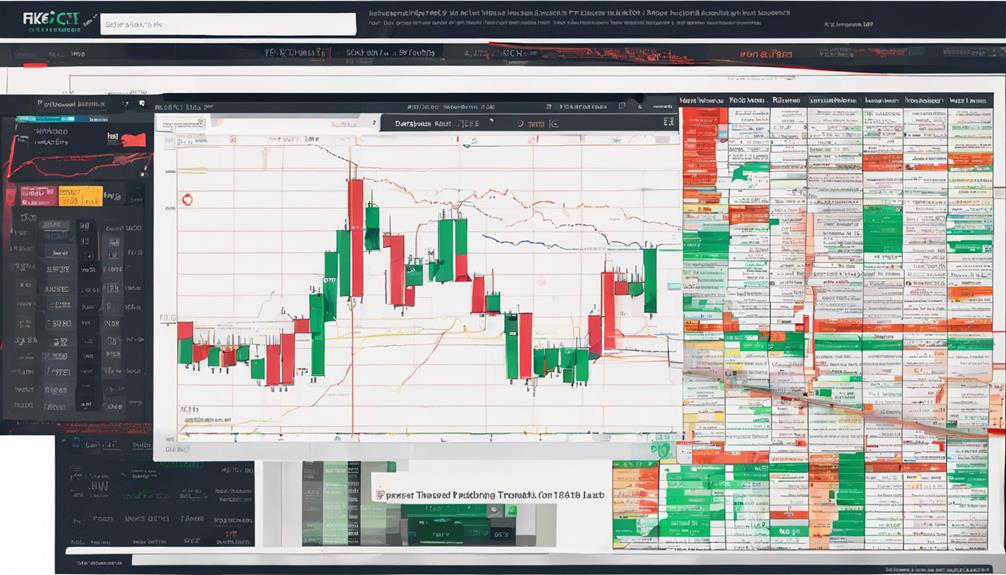
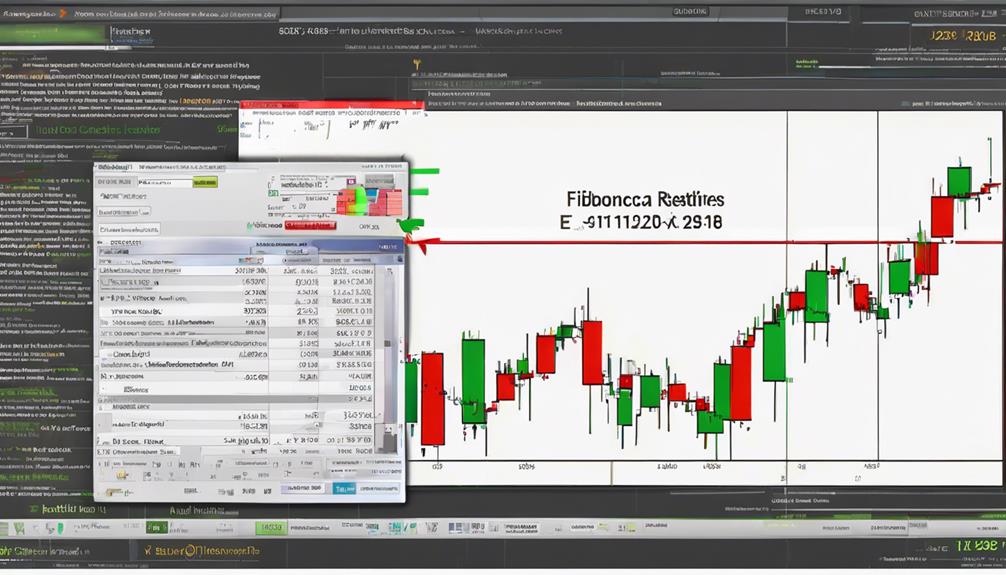
Applying Extensions in Trading
Utilizing Fibonacci extensions in trading enables traders to project precise price targets and strategically manage risk within the financial markets. These percentage-based levels, such as 61.8%, 100%, and 161.8%, serve as projection areas for potential reversal points or profit-taking zones.
By multiplying the price movement with key ratios like 1.618 or 2.618, traders can calculate Fibonacci extension levels to aid in decision-making and trading strategies. Risk management is vital when using Fibonacci extensions, as setting stop-loss levels slightly below these extension levels helps limit potential losses.
When combined with Fibonacci retracement levels, extensions provide a detailed framework for traders to analyze price movements effectively and plan their trades with precision.
Optimizing Fibonacci Trading Strategy
An effective approach to enhancing trading strategies involves optimizing the utilization of Fibonacci extensions in conjunction with other technical indicators for improved risk management and decision-making capabilities.
When optimizing a Fibonacci trading strategy, traders can consider the following:
- Utilizing Fibonacci extensions to set precise profit targets beyond current trend levels.
- Implementing trailing stops with Fibonacci extensions to secure profits as the trend progresses.
- Integrating Fibonacci extensions with other technical indicators to enhance risk management and decision-making processes.
Can Fibonacci Extensions be Applied to Predict Biotech Stocks Trends in Hong Kong?
When it comes to predicting Hong Kong’s biotech future, Fibonacci extensions can be a valuable tool. By applying this technique, investors can analyze stock trends and identify potential support and resistance levels for biotech stocks in Hong Kong. This can help in making informed investment decisions and predicting future market movements.
Frequently Asked Questions
How to Master Fibonacci?
To master Fibonacci strategies, traders need a solid understanding of:
- Fibonacci levels
- Ratios
- Retracements
- Patterns
- Tools
- Analysis
- Indicators.
Utilizing Fibonacci extensions, traders can predict potential reversal areas and set stop-loss levels effectively. By calculating Fibonacci ratios and applying them to price movements, traders can make informed decisions based on technical analysis.
Mastery of Fibonacci techniques involves recognizing patterns and using these tools to enhance trading strategies.
How Do You Use Fibonacci Extension in Trading?
Fibonacci extensions in trading leverage key ratios like 61.8% and 161.8% to forecast potential price targets and reversals. Traders apply these levels to identify entry points, set price targets, and manage risks effectively.
By extending lines from significant price points, traders can anticipate market trends, adjust strategies based on market volatility, and enhance decision-making.
Combining Fibonacci basics with sound trading strategies empowers traders to capitalize on price movements and optimize risk-reward ratios.
What Time Frame Is Best for a Fibonacci Extension?
The best time frame for Fibonacci extensions varies based on the trading style and objectives of the trader. Short-term traders like intraday and scalping strategies often utilize shorter time frames like 1-hour or 4-hour charts for precise Fibonacci extension analysis.
Conversely, swing traders looking to capture medium-term trends may opt for daily or weekly charts.
Long-term investors seeking major price targets might prefer monthly or quarterly charts for Fibonacci extensions, considering trend analysis and market conditions.
Volatility factors also play an essential role in choosing the appropriate time frame for accurate Fibonacci extension application.
How to Use Fibonacci Extensions to Know When to Take Profit?
Utilizing Fibonacci extensions for profit-taking involves setting price targets based on key Fibonacci levels. Traders can strategically exit positions at these levels to secure gains and manage risk effectively.
Conclusion
In summary, mastering Fibonacci extensions is an essential aspect of trading that requires a thorough understanding of the principles and techniques involved.
By utilizing Fibonacci levels effectively, traders can identify potential price targets, reversal zones, and time zones for forecasting market movements.
Implementing Fibonacci strategies in trading can improve risk management and optimize trading outcomes.
Overall, a holistic approach to Fibonacci extensions can enhance trading performance and decision-making processes in the financial markets.
