
Master the art of day trading by harnessing volume indicators. On-Balance Volume, Money Flow Index, and Volume-Weighted Average Price are essential tools. Volume patterns indicate market sentiment, leading to profitable strategies. High volumes confirm trend strength and signal potential reversals. These indicators validate breakouts and aid in risk management. Understanding volume's relationship with price action is key. Enhance trading decisions by leveraging volume insights. Mastering these indicators elevates your day trading success.
Understanding Volume Indicators
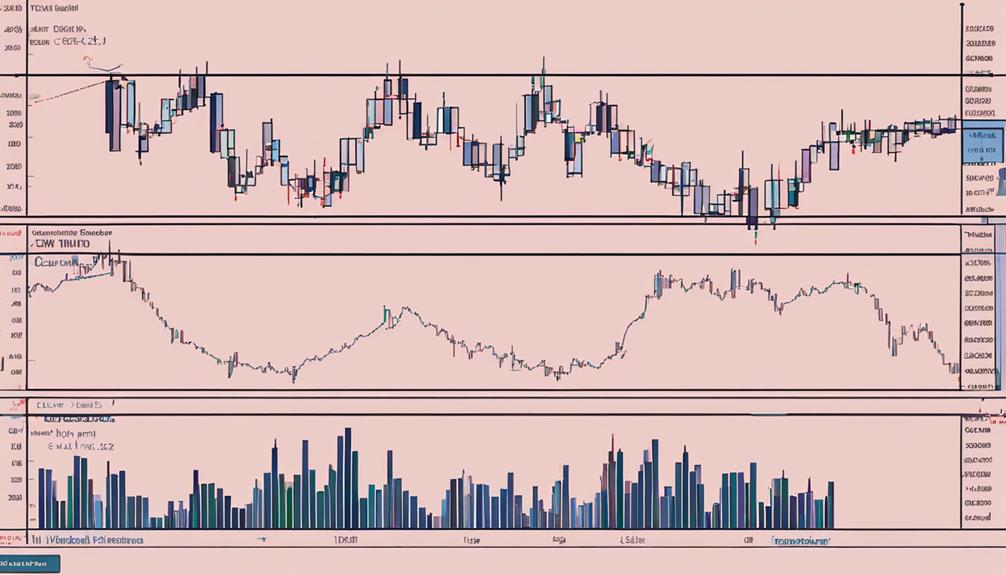
When delving into the domain of day trading, an essential aspect to grasp is the significance and functionality of volume indicators. Volume indicators play a pivotal role in analyzing the activity surrounding a particular stock or asset on a given trading day. These indicators provide valuable insights into the level of market participation, the strength behind price movements, and potential trend reversals.
On-Balance Volume (OBV) is one such indicator that sums up the volume on up days and subtracts the volume on down days, offering a clear direction of a stock based on the conviction behind each day's move. Money Flow Index (MFI), on the other hand, combines time, volume, and price to gauge buying and selling pressure, identifying areas of overbought or oversold conditions and potential entry signals. Additionally, the Volume-Weighted Average Price (VWAP) showcases the average price an asset traded at during the trading session, integrating both price and volume to visualize price action trends effectively.
Understanding these volume indicators is essential for day traders as they aid in interpreting volume data efficiently, assisting in identifying quality entry and exit points by cutting through market noise and illustrating the relationship between price movements and trading volume.
Importance of Volume in Day Trading
Volume is a key metric in day trading as it signifies market activity, confirming price movements and often preceding price changes. Understanding the importance of volume allows traders to gauge the strength of trends and potential reversals, aiding in making informed trading decisions.
Volume Signifies Market Activity
Market activity in day trading is significantly influenced by the volume of shares traded, providing valuable insights into the dynamics of trading and liquidity levels. Understanding how to interpret volume is essential for trading stocks effectively.
High trading volumes often accompany significant price movements, indicating increased interest from traders and potentially confirming the strength of a breakout. On the other hand, low volumes during breakouts may suggest weak conviction behind the move, potentially leading to false signals.
Volume spikes at trend extremes can indicate sentiment shifts, presenting opportunities for profitable but riskier reversal trades. By analyzing volume patterns and using indicators like OBV, MFI, and VWAP, traders can interpret market activity more accurately, aiding in making informed decisions while day trading.
Volume Confirms Price Movements
The correlation between trading volume and price movements serves as an essential indicator in day trading strategies, providing valuable insights into market dynamics and trader sentiment. Volume in day trading confirms price movements by revealing the conviction behind stock price changes. Analyzing volume allows traders to gauge the strength of price movements, aiding in making informed trading decisions.
High volume during breakouts signifies strong confirmation, while low volume breakouts may be less reliable. Volume plays a pivotal role in identifying trend reversals and confirming bullish or bearish sentiment. Understanding the relationship between volume and price movements is critical for the success of day trading strategies, as it helps traders navigate the complexities of the market with more precision and confidence.
Volume Precedes Price Changes
Anticipating price changes in day trading can be enhanced through proactive analysis of volume patterns, offering valuable insights into potential shifts in market sentiment. Volume often precedes price changes, acting as an indicator that every trader should consider.
By monitoring volume patterns, traders can anticipate and confirm price movements before they occur, gaining an edge in the market. Significant volume spikes signal increased interest and participation in a stock, often leading to substantial price changes.
Understanding the relationship between volume and price is essential for making informed trading decisions and improving profitability. Volume indicators serve as vital tools for day traders, helping them gauge market activity, identify trends, and make well-informed trading choices based on concrete data.
Using Volume for Breakout Confirmation
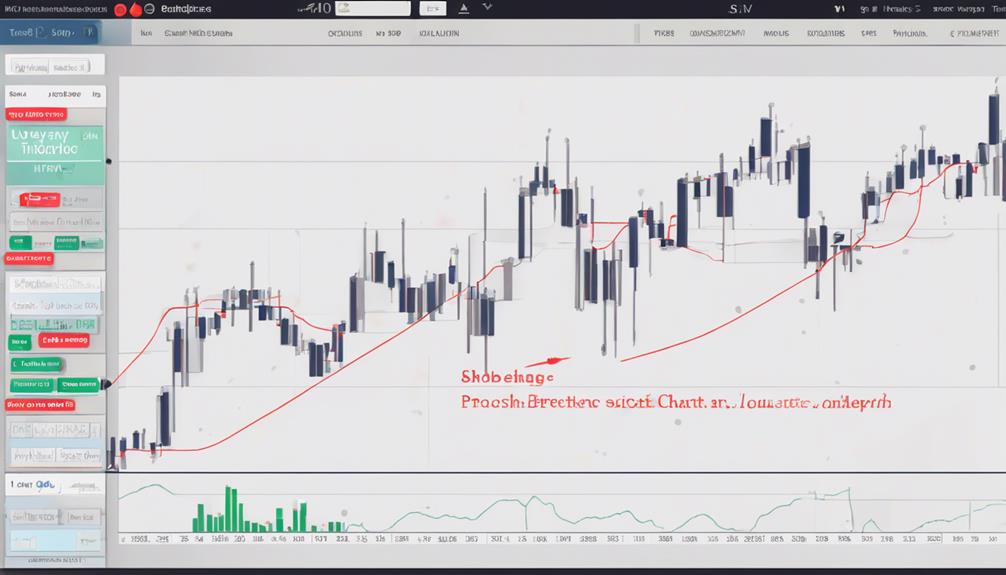
During breakout confirmation, analyzing volume spikes is essential for evaluating the strength and sustainability of the price movement. A volume spike during a breakout confirms the strength of the move, indicating increased interest and conviction among traders. High volume accompanying a breakout provides strong confirmation of the price movement, suggesting a continuation of the trend. Conversely, breakouts with low volume may be false signals, lacking the necessary conviction to sustain the move. Traders often look for significant volume increases to support breakout trades as it signifies the potential for sustained price momentum. Volume analysis during breakouts helps traders gauge market sentiment and participation, aiding in decision-making for effective trading strategies.
| Volume Analysis for Breakout Confirmation | ||||
|---|---|---|---|---|
| Aspect | High Volume | Low Volume | Volume Spike | Implications |
| Confirmation | Strong | Weak | Strong | Sustained Price Movement |
| Market Conviction | High Interest | Lack of Interest | Increased Conviction | Potential False Signals |
| Price Momentum | Continuation | Reversal | Potential Momentum | Market Sentiment Analysis |
Leveraging Volume for Reversal Trades
Analyzing volume indicators plays a critical role in identifying sentiment shifts and potential reversal opportunities in the market when engaging in reversal trades. In reversal trades, traders utilize volume indicators to gauge the strength of a potential trend change. High volume spikes at trend extremes often precede price reversals, indicating a shift in market sentiment.
By observing divergence between volume and price movements, traders can further validate their reversal trade decisions. Understanding the intricate relationship between volume and price action is paramount for effectively leveraging volume indicators in reversal trades. Volume analysis equips traders with the foresight to anticipate and capitalize on impending trend changes, enhancing the overall success rate of their trading strategies.
Incorporating volume indicators into the decision-making process for reversal trades can provide valuable insights and assist traders in making informed and timely trading decisions.
Confirming Trends With Volume
Volume serves as an essential metric in confirming the strength of trends by reflecting the level of conviction behind price movements. When analyzing trends with volume indicators, traders look for specific signals to validate the market sentiment effectively:
- Increasing Volume: A rise in trading volume supports the continuation of a trend, showcasing sustained interest in the asset and reinforcing the current market direction.
- Low Volume Warning: Conversely, low volume during a trend may indicate weakness in the trend's momentum, potentially signaling an upcoming trend reversal or a period of consolidation.
- Volume Indicators: Tools like On-Balance Volume (OBV) and Money Flow Index (MFI) provide traders with valuable insights into trend confirmation based on volume analysis, helping them make informed trading decisions.
- Avoiding False Breakouts: Monitoring volume alongside price movements can assist traders in distinguishing genuine trend movements from false breakouts, leading to more accurate trading strategies and improved risk management.
Popular Volume Indicator Types

One of the key aspects in evaluating market dynamics is comprehending the significance of popular volume indicator types in measuring trading activity and market sentiment.
On-Balance Volume (OBV) tracks the direction of a stock by summing volume on up days and subtracting volume on down days, indicating conviction behind each day's move.
Money Flow Index (MFI) assesses buying and selling pressure, identifying overbought or oversold areas by analyzing time, volume, and price.
Volume-Weighted Average Price (VWAP) confirms trends by showing the average price an asset traded at throughout the session, incorporating both price and volume.
Traders observe the direction of the OBV indicator to detect divergence from the stock price. MFI is essential for spotting divergences and signaling potential entries based on overbought or oversold territories, considering volume in comparison to the Relative Strength Index (RSI).
Understanding these popular volume indicators aids traders in making informed decisions on whether to buy or sell, and when assets are overbought or oversold.
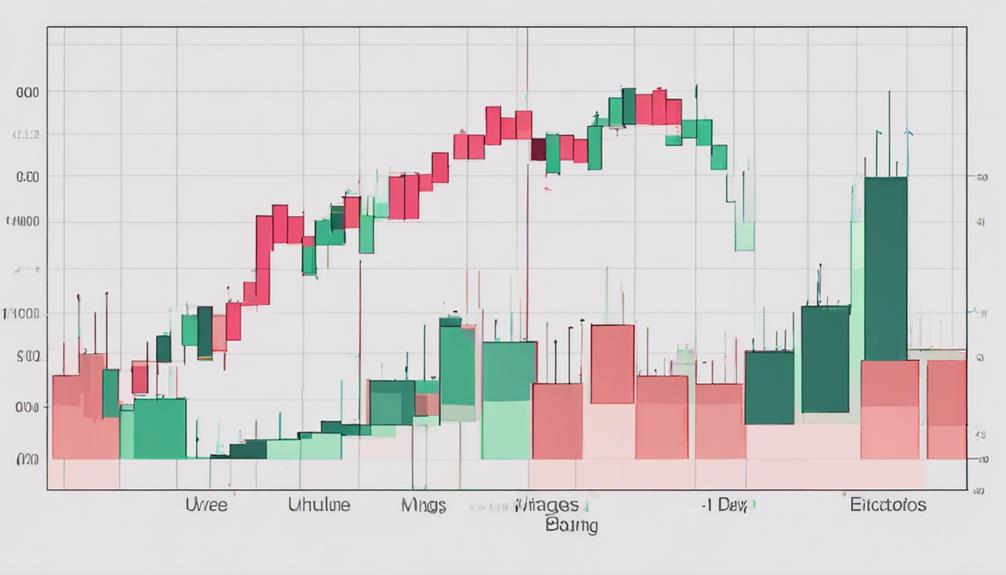
Interpreting Volume Patterns
Volume patterns in day trading provide valuable insights for traders. By spotting accumulation/distribution zones, understanding buying/selling pressure, and identifying trend confirmation signals, traders can make informed decisions based on market dynamics.
These patterns offer a data-driven approach to interpreting market sentiment and potential price movements.
Spotting Accumulation/Distribution Zones
Spotting accumulation and distribution zones through volume patterns is an essential aspect of technical analysis for traders seeking to anticipate potential price movements. When interpreting volume patterns, traders should consider the following:
- Accumulation Zones: These zones exhibit increased buying activity and rising volume levels, indicating a potential price appreciation in the near future.
- Distribution Zones: These areas signify selling pressure and decreasing volume, potentially foreshadowing a price decline.
- Bullish Breakouts: Volume patterns within accumulation zones often precede bullish breakouts, presenting lucrative trading opportunities.
- Bearish Reversals: Identifying distribution zones through volume patterns can help traders foresee potential bearish reversals, aiding in risk management strategies.
Understanding these volume patterns can significantly enhance trading decision-making and profitability for day traders.
Understanding Buying/Selling Pressure
Analyzing spikes in volume is essential for day traders to accurately assess the prevailing buying or selling pressure in the market. High volume on up days indicates strong buying pressure, signaling increased demand for the asset. Conversely, high volume on down days reflects significant selling pressure, suggesting a higher supply of the asset in the market.
Understanding these volume patterns allows traders to interpret the intensity of buy and sell activities, aiding in the identification of potential trend reversals or continuations. By analyzing volume alongside price movements, traders can confirm the validity of market trends and make well-informed trading decisions. Volume confirmation is vital for validating breakouts or breakdowns, ensuring that price movements are supported by substantial buying or selling interest.
Identifying Trend Confirmation Signals
In the domain of day trading, interpreting volume patterns plays a critical role in identifying trend confirmation signals. When analyzing volume indicators to enhance your trading strategy, focusing on high volume can provide valuable insights. Here are essential points to ponder:
- High volume in the direction of the trend confirms its strength and validity, indicating market conviction.
- Increasing volume during a price move supports bullish sentiment, suggesting a sustainable trend.
- Volume patterns that align with price action help traders identify potential trend reversals or continuations.
- Divergence between volume and price movements can signal a weakening trend or upcoming reversal.
Incorporating Volume in Trading Strategies
Incorporating volume analysis into trading strategies is essential for evaluating the strength of price movements and making informed trading decisions based on market activity. Volume indicators such as On-Balance Volume (OBV), Money Flow Index (MFI), and Volume Weighted Average Price (VWAP) play an important role in providing insights into market conviction and confirming trends, which are essential for effective trading strategies.
By analyzing volume in trading strategies, traders can pinpoint potential entry and exit points by understanding the correlation between volume and price action. This integration of volume indicators not only enhances the accuracy of trading signals but also improves the overall success rate of day trading strategies.
Additionally, incorporating volume analysis enables traders to gauge market interest, predict price momentum, and validate chart patterns, leading to more profitable trades. Therefore, a thorough understanding and utilization of volume indicators in trading strategies are paramount for achieving success in the dynamic world of day trading.
Enhancing Market Sentiment Analysis
Could volume indicators be the key to uncovering a deeper understanding of market sentiment analysis? When it comes to enhancing market sentiment analysis, volume indicators play a vital role in providing valuable insights into the strength and direction of market sentiment. Here are four key ways in which volume indicators can enhance market sentiment analysis:
- Assessing Buying and Selling Pressure: Volume indicators like On-Balance Volume (OBV) and Money Flow Index (MFI) help traders gauge the level of buying and selling pressure in the market.
- Informed Trading Decisions: Understanding market sentiment through volume indicators enables traders to make more informed decisions by identifying shifts in sentiment early on.
- Signaling Potential Shifts: Divergence between price action and volume indicators can act as a warning sign for potential shifts in market sentiment, allowing traders to adjust their strategies accordingly.
- Accurate Sentiment Strength: By incorporating volume indicators in their analysis, traders can accurately assess the strength or weakness of market sentiment, helping them navigate volatile market conditions more effectively.
Volume Indicators for Scalping
Volume indicators play an essential role in scalping by enabling traders to gauge the intensity and strength of price movements, facilitating rapid decision-making and enhancing trade timing. In scalping, where traders aim to capitalize on short-term price fluctuations for quick profits, volume indicators serve as pivotal tools.
By analyzing volume spikes, scalpers can identify potential entry and exit points swiftly. Effective use of volume indicators can assist scalpers in detecting market sentiment shifts and confirming trading opportunities. When volume indicators are trending higher during a scalping session, it indicates increased activity and interest in a particular asset, potentially signaling a more significant price movement.
Scalpers rely on these signals to make informed decisions quickly, helping them execute trades with precision and efficiency. Understanding volume indicators in scalping not only improves trade timing but also enhances overall trading performance by providing valuable insights into market dynamics.
Volume Indicators for Swing Trading
Volume spikes play an essential role in swing trading by indicating significant market interest and confirming the direction of the trend. Understanding the relationship between volume spikes and price movements is vital for swing traders to validate their trading decisions.
Volume Spikes Importance
An important element to take into account in swing trading is the importance of abrupt rises in trading activity, which can offer valuable insights into market dynamics and potential price movements. When analyzing volume spikes in swing trading:
- Confirm Breakouts: Volume spikes indicate increased trading activity during price breakouts.
- Strength of Trend: High volume spikes during a breakout confirm the strength of a new trend.
- Market Sentiment Shifts: Volume spikes at trend extremes signal potential shifts in market sentiment.
- Identifying Reversals: Traders use volume spikes to confirm trend directions and spot possible reversals.
Understanding the significance of volume spikes in swing trading is essential for evaluating market interest, liquidity, and potential price momentum accurately.
Confirm Trend Direction
Analyzing volume indicators in swing trading provides valuable insights into confirming trend direction and making informed trading decisions based on buying and selling pressure. Volume indicators such as On-Balance Volume (OBV) and Money Flow Index (MFI) play an important role in swing trading strategies. OBV calculates the cumulative volume flow by adding volume on up days and subtracting volume on down days, indicating the stock's trend direction based on conviction. On the other hand, MFI, a technical oscillator, helps identify overbought and oversold areas, signaling potential entry points. Additionally, incorporating the Volume-Weighted Average Price (VWAP) in analysis aids in visualizing the average price traded throughout a session, enhancing decision-making processes for swing traders.
| Volume Indicators | Functionality |
|---|---|
| OBV | Confirms trend direction |
| MFI | Identifies overbought and oversold |
| VWAP | Visualizes average traded price |
Volume Indicators for Momentum Trading
Utilizing key volume indicators tailored for momentum trading can provide traders with valuable insights into market dynamics and potential trade opportunities. When focusing on momentum trading, volume indicators play an essential role in confirming trends and identifying potential entry and exit points.
Here are four essential volume indicators for momentum trading:
- On-Balance Volume (OBV): Tracks buying and selling pressure to confirm momentum in a trade, helping traders gauge the strength of a trend.
- Money Flow Index (MFI): Identifies overbought or oversold conditions by analyzing both volume and price data, assisting traders in spotting potential reversal points.
- Volume-Weighted Average Price (VWAP): Calculates the average price weighted by volume, aiding traders in confirming trends and making informed trading decisions.
- Divergence Analysis: Traders look for disparities between volume indicators and price movements to anticipate potential shifts in momentum, providing valuable insights for trade setups.
Real-time Volume Analysis Tools
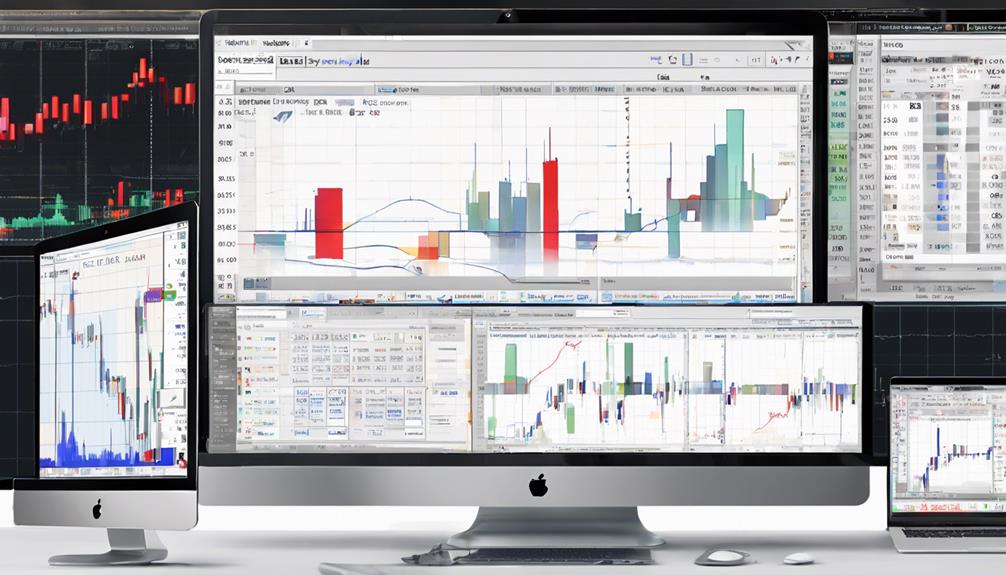
Real-time volume analysis tools provide traders with up-to-the-minute insights into stock direction and market sentiment based on the conviction behind daily moves. These tools, such as On-Balance Volume (OBV), Money Flow Index (MFI), and Volume-Weighted Average Price (VWAP), offer valuable information for day traders to make informed decisions. Below is a comparison table highlighting the key features of these real-time volume analysis tools:
| Tool | Key Features |
|---|---|
| On-Balance Volume (OBV) | Tracks stock direction based on conviction behind daily moves |
| Money Flow Index (MFI) | Analyzes buying and selling pressure to identify overbought or oversold areas |
| Volume-Weighted Average Price (VWAP) | Indicates the average trading price throughout a session, aiding in trend confirmation |
Volume Indicators for Risk Management
Volume indicators play an essential role in evaluating and managing risks in day trading by providing valuable insights into the market's conviction behind price movements. Understanding volume is vital for effective risk management as it helps traders assess the strength of trends and potential reversals.
Here are four key ways volume indicators contribute to risk management:
- Identifying Trend Strength: Volume indicators such as On-Balance Volume (OBV) can help traders gauge the strength of a trend, indicating whether it is likely to continue or potentially reverse.
- Spotting Overbought or Oversold Conditions: Indicators like Money Flow Index (MFI) and Volume-Weighted Average Price (VWAP) can assist in identifying extreme market conditions, signaling potential risk levels.
- Minimizing Losses: By incorporating volume indicators into trading strategies, traders can make more informed decisions, leading to better risk management and minimizing potential losses.
- Confirmation Signals for Entry and Exit Points: Utilizing volume indicators effectively can provide valuable confirmation signals for determining the best entry and exit points, enhancing overall risk management strategies.
Implementing Volume Indicators Effectively
Incorporating volume indicators effectively is pivotal for enhancing trading strategies and optimizing risk management in day trading. These indicators provide a quantitative measure of how much volume is associated with price movements, offering valuable insights into market dynamics.
For instance, On-Balance Volume (OBV) serves as an indicator that shows the cumulative volume to predict stock direction. Money Flow Index (MFI) is another essential tool that measures buying and selling pressure, identifies divergences, and highlights overbought or oversold areas. Additionally, Volume-Weighted Average Price (VWAP) is a useful indicator that demonstrates the average price weighted by volume, aiding in understanding price trends throughout the trading session.
How Can Volume Indicators Improve Day Trading Strategies?
Volume indicators can enhance trading decisions with CMF indicator by providing insight into the strength of price movements. Day traders can use these indicators to confirm buy or sell signals, identify trend reversals, and gauge the overall market sentiment. By incorporating volume indicators into their strategy, traders can make more informed and profitable decisions.
Frequently Asked Questions
What Is the Best Volume Indicator for Day Trading?
When it comes to volume analysis in day trading, selecting the most suitable volume indicator is vital for effective trading strategies. Traders often rely on indicators like On-Balance Volume (OBV), Money Flow Index (MFI), and Volume-Weighted Average Price (VWAP) to interpret volume data accurately.
What Is the Most Effective Indicator for Day Trading?
When evaluating the most effective indicator for day trading, considering trading psychology and risk management is essential. Incorporating candlestick patterns and chart analysis alongside technical indicators can enhance decision-making.
Which Is the Best Indicator for Volume in Trading View?
When analyzing volume in TradingView, traders often utilize various indicators like Volume Profile, VWAP, Chaikin Money Flow, and OBV to gauge market activity. Each indicator offers unique insights into volume dynamics, assisting in identifying support/resistance levels, trend reversals, and strength of trends.
Integrating multiple volume indicators can provide a thorough view for informed trading decisions. Tailoring trading strategies to leverage these indicators effectively can enhance overall performance in volume analysis.
How Do You Use a Volume Profile Indicator for Day Trading?
Volume analysis with a volume profile indicator can enhance intraday strategies by identifying key price levels based on trading activity.
Traders can utilize volume nodes and value areas to pinpoint areas of interest for potential reversals or breakouts.
Conclusion
To sum up, mastering the art of day trading requires a deep understanding and effective use of volume indicators. By leveraging volume for breakout confirmation, reversal trades, trend confirmation, momentum trading, and risk management, traders can make more informed decisions and improve their overall trading success.
Utilizing real-time volume analysis tools can further enhance trading strategies and increase profitability. Ultimately, incorporating volume indicators into trading techniques can provide valuable insights and help traders navigate the complexities of the market with confidence.