
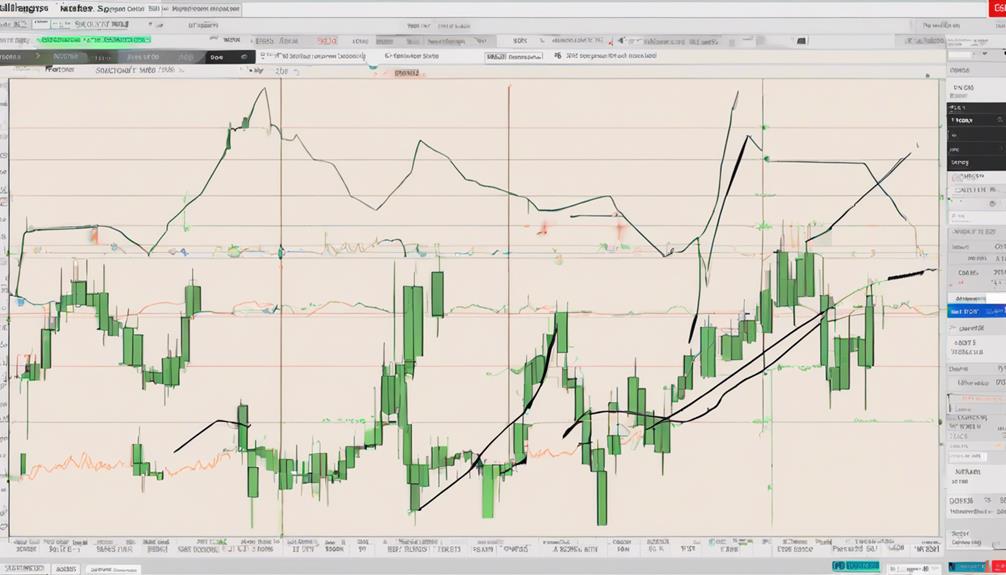
Enhancing your trading strategy with Bollinger Bands and RSI involves combining these technical indicators strategically. Bollinger Bands offer insights into market volatility, while RSI signals indicate potential overbought or oversold conditions. By customizing Bollinger Bands parameters and leveraging RSI for entry and exit points, traders can enhance decision-making accuracy and risk management. Adjusting stop-loss positions based on Bollinger Bands levels, aligning them with support and resistance, further refines trading strategies. Testing various RSI and Bollinger Bands combinations can help identify best settings for trend identification. Fine-tuning band width and utilizing RSI for exit decisions are essential for successful trading strategies. Mastering these techniques is key to maximizing trading effectiveness.
Understanding Bollinger Bands Calculation
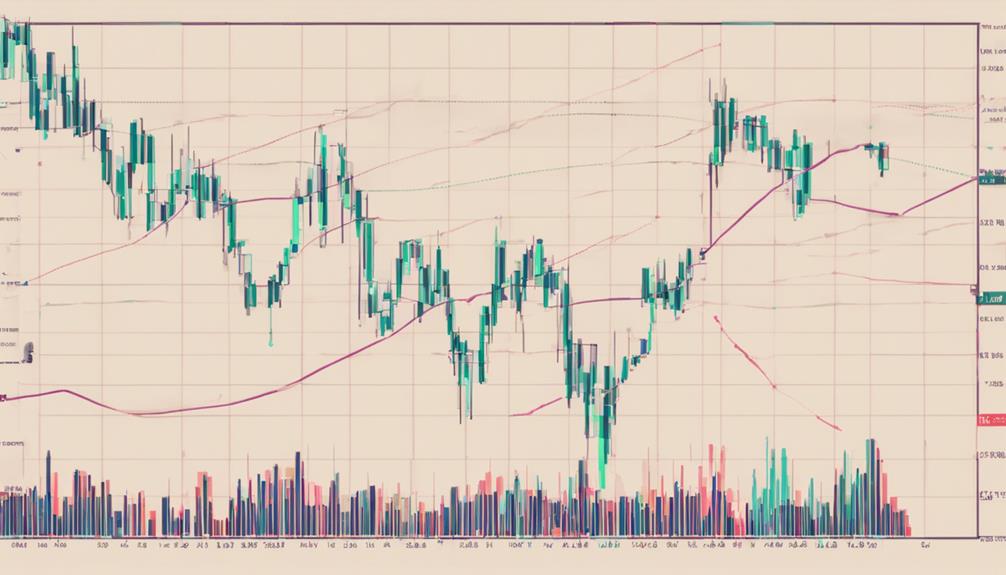
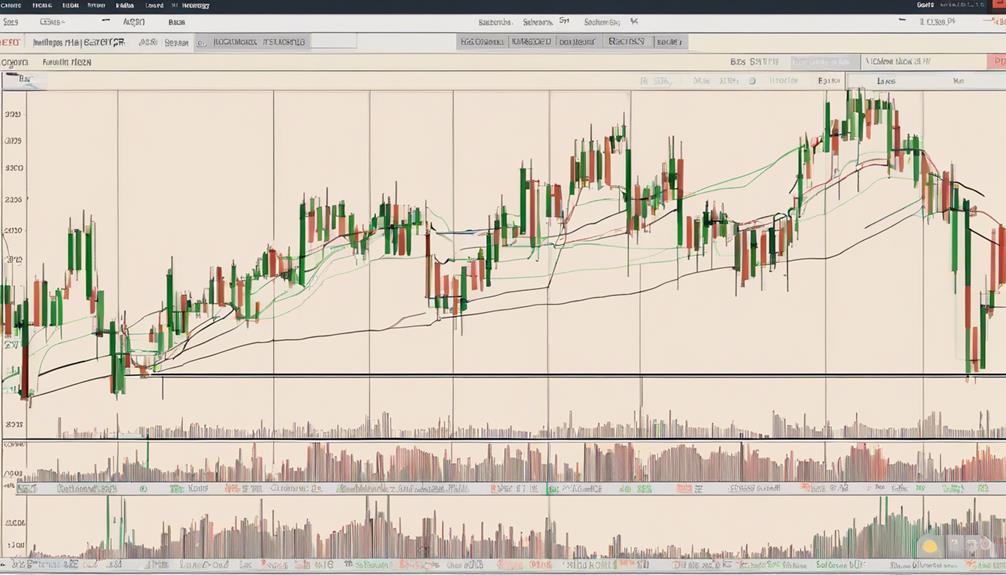
Understanding the calculation of Bollinger Bands is fundamental for traders aiming to utilize this technical analysis tool effectively in their trading strategies. Bollinger Bands consist of three lines: the middle band, which is a 20-period simple moving average (SMA) of the price; the upper band, calculated by adding two standard deviations to the SMA; and the lower band, calculated by subtracting two standard deviations from the SMA.
These bands dynamically adjust to market conditions, expanding during periods of high volatility and contracting during low volatility. Traders use Bollinger Bands to identify potential price breakouts, reversals, and trend strength. When the price touches the upper band, it may indicate overbought conditions, while touching the lower band may suggest oversold conditions.
Understanding the interplay between Bollinger Bands and price movements enables traders to make informed decisions based on volatility and potential price levels.
Interpreting RSI Signals Effectively
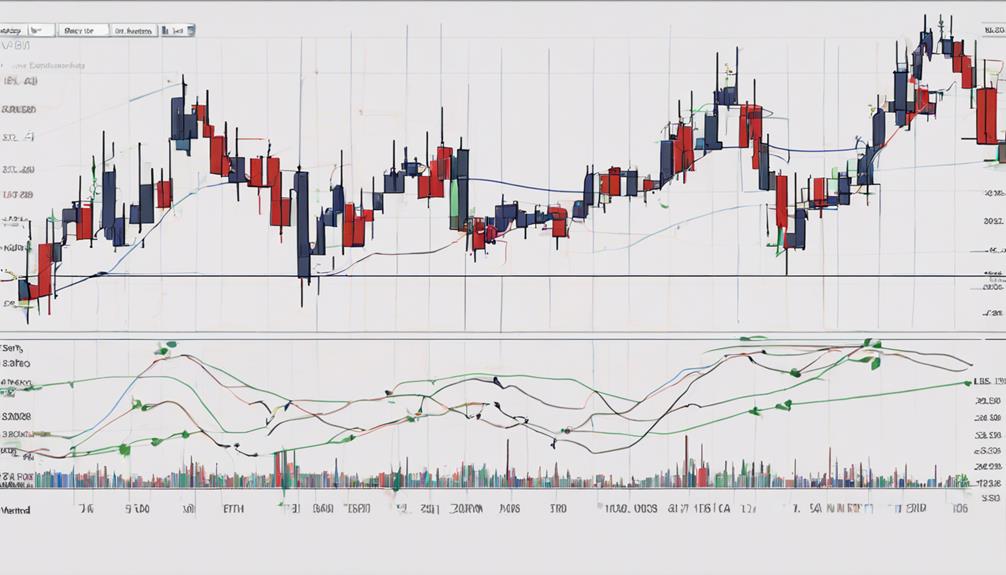
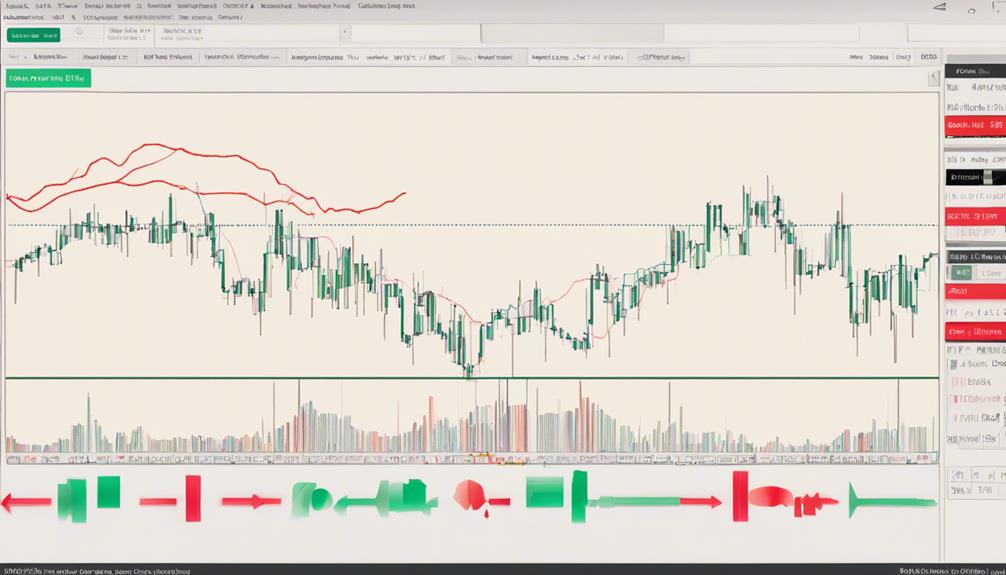
Analyzing RSI signals effectively is vital for traders seeking to gauge market momentum and make informed decisions regarding entry and exit points. The Relative Strength Index (RSI) values above 70 indicate overbought market conditions, potentially signaling a reversal in price action. Conversely, RSI values below 30 suggest oversold market conditions, indicating a possible buying opportunity. RSI is a customizable indicator that can be adjusted for precision and sensitivity in analyzing market conditions, providing insights into the momentum of price movements. Understanding these RSI signals is essential for traders to optimize their trading strategies and capitalize on market opportunities with enhanced accuracy.
| RSI Signal | Market Condition | Implication |
|---|---|---|
| RSI > 70 | Overbought | Reversal potential |
| RSI < 30 | Oversold | Buying opportunity |
| RSI Trending | Consistent Movement | Sustained price action likely |
| RSI Divergence | Price vs. RSI Movement | Potential trend reversal indicator |
| RSI at Extremes | High/Low Values | Signal strength of market momentum |
Optimizing Bollinger Bands Parameters
Adjusting Bollinger Bands parameters involves narrowing band width, testing different lengths, and fine-tuning standard deviation. These adjustments can notably impact the bands' sensitivity and responsiveness to price changes.
Narrowing Band Width
Amidst the dynamic landscape of trading strategies, the optimization of Bollinger Bands parameters, specifically focusing on narrowing band width, plays a pivotal role in anticipating market volatility shifts. When Bollinger Bands contract, indicating a narrowing band width, traders should take note as it signifies decreasing volatility.
Here's how this phenomenon can be leveraged for trading opportunities:
- Anticipating Breakouts: Narrowing bands suggest a potential price breakout or significant move.
- Forecasting Volatility: Traders can use this signal to prepare for a shift from low to high volatility.
- Trend Shifts: Monitoring band width can help anticipate potential trend shifts.
- Identifying Reversals: Narrowing bands often precede price reversals, offering valuable insights for traders.
Testing Different Lengths
In the domain of refining trading strategies, exploring various lengths for Bollinger Bands parameters presents an essential avenue for optimizing trading performance. By testing different lengths, traders can fine-tune the Bollinger Bands to better suit the current market conditions and enhance the accuracy of signals generated.
Adjusting the parameters can help in capturing changes in volatility, improving risk management, and refining entry and exit points. Analyzing historical data is vital in determining the most effective combination of Bollinger Bands lengths for a specific trading strategy.
Through this process, traders can gain insights into how different lengths impact signal reliability and overall performance, ultimately leading to more informed trading decisions.
Adjusting Standard Deviation
Optimizing the standard deviation parameter in Bollinger Bands plays a pivotal role in refining the sensitivity to price fluctuations and enhancing market analysis accuracy. When adjusting the standard deviation:
- Increasing it widens the Bollinger Bands, indicating higher volatility.
- Decreasing it narrows the Bands, signaling lower volatility and potential price consolidation.
- Optimization provides clearer signals for trend reversals and breakouts.
- Understanding how changes in standard deviation impact the width of the Bollinger Bands is essential for effective technical analysis.
Leveraging RSI for Entry Points
When utilizing the Relative Strength Index (RSI) for entry points in trading, understanding its overbought and oversold conditions is essential. RSI values above 70 present potential opportunities to sell, while values below 30 indicate potential buying chances.
RSI Entry Signals
Utilizing Relative Strength Index (RSI) entry signals can greatly enhance the precision of trade entries in a market environment. When leveraging RSI for entry points, traders should consider the following:
- RSI crossing above 30 indicates potential buying opportunities.
- RSI dropping below 70 suggests considering selling positions.
- Watch for RSI divergence from price action for early entry signals.
- Combine RSI entry signals with Bollinger Bands confirmation for increased accuracy in decision-making.
Timing Trade Entries
Moving from the discussion on RSI entry signals, the focus now shifts towards refining trade entry timing by leveraging Relative Strength Index (RSI) for precise entry points in the market.
RSI values below 30 indicate oversold conditions, suggesting potential buying opportunities. Traders should wait for RSI to cross above 30 to confirm the commencement of an uptrend for best entry points.
Conversely, RSI levels exceeding 70 signify overbought conditions, signaling potential selling positions. Monitoring RSI dropping below 70 can serve as a cue to exit long positions and secure profits.
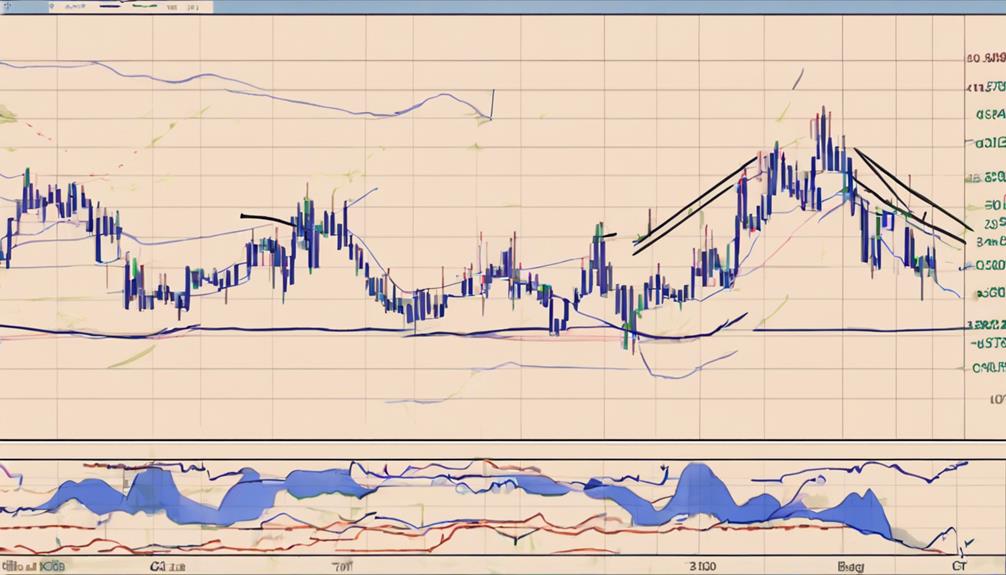
Stop-Loss Strategies With Bollinger Bands
Implementing dynamic stop-loss strategies using Bollinger Bands enhances risk management in trading by adjusting positions based on market volatility and key technical levels. When utilizing Bollinger Bands for stop-loss placement, traders can benefit from a thorough approach that considers various factors influencing price movements.
Here are some key strategies for setting stop-loss levels with Bollinger Bands:
- Incorporate Market Volatility: Adjust stop-loss positions based on the width of the Bollinger Bands, expanding them during high volatility periods to account for increased price fluctuations.
- Utilize Support and Resistance Levels: Confirm stop-loss placements by aligning them with significant support and resistance levels identified through technical analysis alongside Bollinger Bands.
- Analyze Historical Price Movements: Determine effective stop-loss positions by examining historical price movements in relation to Bollinger Bands to gauge potential stop-loss levels.
- Backtest Stop-Loss Strategies: Validate stop-loss approaches through backtesting to assess their effectiveness across different market conditions and refine them for improved risk management.
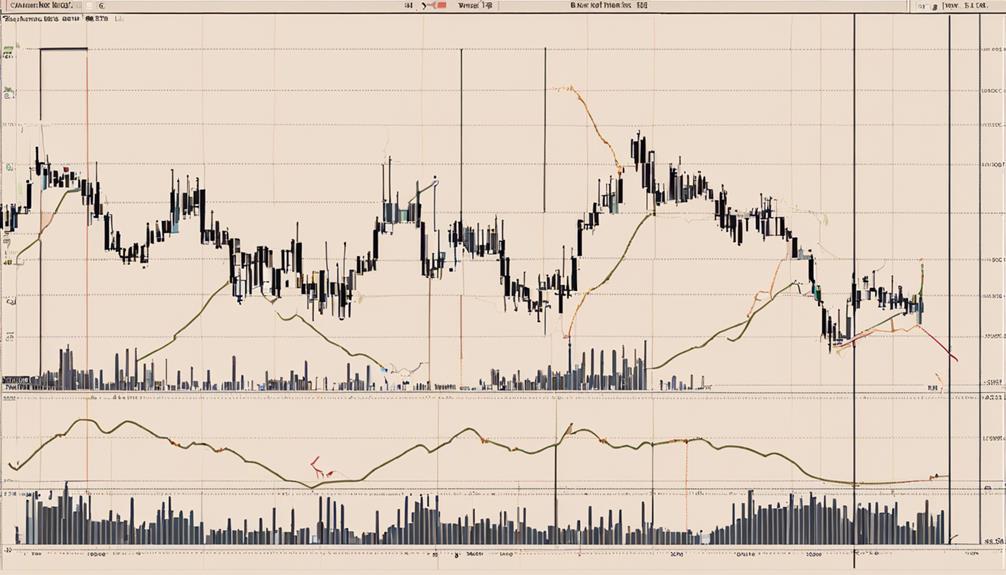
Testing RSI and Bollinger Bands Combinations
When examining trading strategies involving RSI and Bollinger Bands combinations, a vital analysis of price movements over a designated timeframe is essential. Traders often test RSI values above 70 and below 30 in conjunction with Bollinger Bands to identify overbought or oversold conditions.
By backtesting various combinations of RSI and Bollinger Bands parameters, traders can refine their strategies to enhance accuracy and effectiveness. It is important to compare the outcomes of using RSI and Bollinger Bands separately against integrating them to gauge the impact on trade signals and decision-making processes.
Evaluating the reliability and consistency of signals produced by combining RSI with Bollinger Bands aids in trend identification, recognizing reversal signals, and interpreting volatility indications. This technical analysis approach offers valuable insights into optimizing trading strategies through the strategic convergence of these two powerful indicators.
Fine-Tuning Bollinger Bands Width
Fine-tuning the width of Bollinger Bands plays a crucial role in evaluating market volatility and potential price movements. Adjusting the band width parameters can have a substantial impact on trading decisions by enhancing signal accuracy and improving risk management.
Here are four key aspects to ponder when fine-tuning Bollinger Bands width:
- Narrowing Bands: Decreasing the width of the bands indicates low volatility in the market. This suggests a potential price breakout as the range of price movement becomes constrained.
- Widening Bands: Conversely, widening bands signal increased volatility in the market. This expansion indicates a potential trend change as price movements become more erratic.
- Identifying Trading Opportunities: Monitoring the band width can help traders pinpoint potential entry points based on the level of volatility present in the market.
- Risk Management: Adjusting the Bollinger Bands width parameters can aid in setting appropriate stop-loss levels and managing risk exposure effectively during trading activities.
Implementing RSI for Exit Decisions
Utilizing the Relative Strength Index (RSI) strategically in trading allows for informed exit decisions based on overbought and oversold conditions, enhancing risk management and profit optimization.
When RSI values rise above 70, indicating market overbought conditions, it can serve as a signal to contemplate exiting a trade. Particularly, identifying exit opportunities when RSI drops below 70 after being in the overbought territory can be a prudent strategy.
Conversely, RSI falling below 30 suggests oversold conditions, presenting another potential exit point. Incorporating RSI in exit decisions complements the Bollinger Bands indicator, confirming exit signals generated by this tool.
By combining RSI and Bollinger Bands, traders can pinpoint market extremes more accurately and make timely decisions. This integration enhances the overall effectiveness of exit strategies, contributing to improved trading outcomes and risk management practices.
Incorporating RSI signals into exit points based on the RSI values range offers traders a systematic approach to exiting trades at opportune moments.
Can Bollinger Bands and RSI be Combined with Candlestick Pattern Trading for a More Effective Strategy?
By combining Bollinger Bands and RSI with candlestick pattern trading, traders can create a winning strategy. The synergy of these indicators can help identify potential trend reversals and confirm entry and exit signals. This combination provides a holistic view of the market, leading to a more effective trading strategy.
Frequently Asked Questions
How Do You Use Bollinger Bands and RSI Together?
To effectively utilize Bollinger Bands and RSI together, traders can identify overbought and oversold conditions by observing the price touching the bands and RSI levels above 70 or below 30, respectively.
This integration helps in confirming or rejecting trading signals.
The combination offers a thorough view of market momentum, aiding in trend confirmation and avoiding false signals.
Using these indicators collectively enhances the accuracy of trading decisions.
What Is the Best Indicator to Combine With Bollinger Bands?
When considering the best indicator to combine with Bollinger Bands, traders often look to the Moving Average Convergence Divergence (MACD) indicator.
The MACD's ability to signal changes in momentum and trend direction complements Bollinger Bands' volatility insights.
What Is the Best Strategy for RSI Day Trading?
The best strategy for RSI day trading involves leveraging RSI signals to determine entry points, managing risks, identifying trends, and analyzing volatility. Comparing timeframes, considering market conditions, observing price action, and reviewing backtesting results are pivotal elements.
What Works Well With Bollinger Bands?
When considering what works well with Bollinger Bands, factors such as trend analysis, volatility measurement, entry and exit signals, price action, support and resistance levels, risk management, and market conditions play essential roles.
Bollinger Bands excel in identifying market volatility and potential price breakouts, offering clear visual cues for trend identification and reversal signals.
Their adaptability to a security's trading range makes them a flexible tool for trading strategies.
Conclusion
In the intricate dance of market fluctuations, Bollinger Bands and RSI serve as the guiding stars for traders seeking clarity amidst chaos. By understanding their calculations, interpreting signals effectively, optimizing parameters, and fine-tuning strategies, one can navigate the turbulent waters of trading with precision and insight.
Like skilled navigators charting their course through stormy seas, traders who master these tools can steer their portfolios towards success with confidence and skill.