
Mastering Bollinger Band Width involves precise band setup, volatility interpretation, and strategic trading use. Calculate Band Width accurately based on standard deviation. Interpret wider bands for higher volatility and vice versa. Utilize Band Width for risk management and strategy enhancement. Incorporate Double Bottom Strategy for trend identification. Set entry points with stop-loss and profit targets. Monitor Band Width for informed decision-making. Customize Bollinger Bands settings as needed. Understanding Band Width dynamics aids in market analysis and trade optimization. Explore further for detailed steps on mastering Bollinger Bands effectively.
Understanding Bollinger Band Width
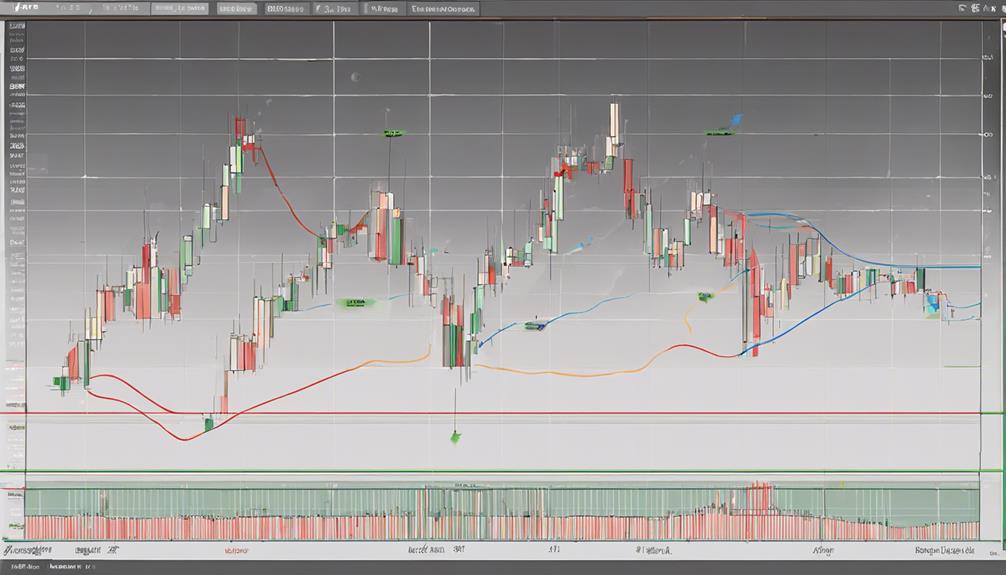
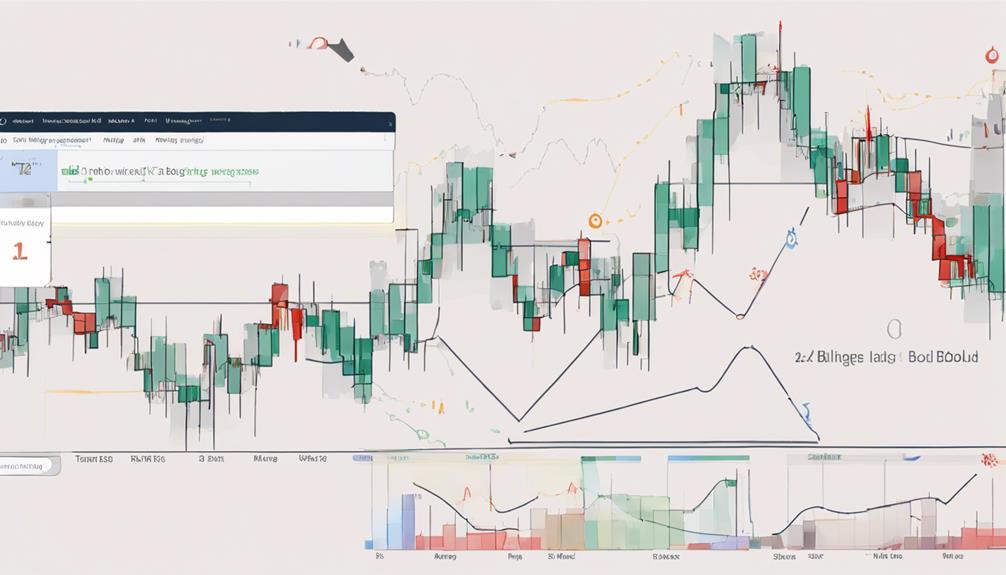
Bollinger Band Width, an important indicator in technical analysis, quantifies the magnitude of price fluctuations by measuring the difference between the upper and lower bands. This metric serves as a vital tool for traders to gauge the volatility of an asset. Wider bands indicate higher volatility, while narrower bands suggest lower volatility. By calculating the Bollinger Band Width as the difference between the upper and lower bands divided by the middle band, traders can assess market conditions with greater precision.
Understanding Bollinger Band Width is essential for identifying potential breakouts in the market. Traders can utilize this indicator to recognize periods of low volatility, which often precede significant price movements. By monitoring the Band Width, market participants can anticipate potential trading opportunities and adjust their strategies accordingly. Overall, mastering the interpretation of Bollinger Band Width empowers traders to make informed decisions based on the prevailing market conditions and the likelihood of price breakouts.
Setting Up Bollinger Bands Correctly
The correct setup of Bollinger Bands involves calculating the band width, selecting appropriate period settings, and interpreting the width values.
Band width calculation is based on the standard deviation multiplier and the chosen period length, which can vary depending on the asset and timeframe.
Understanding the width of the bands is essential for evaluating market volatility and making informed trading decisions.
Band Width Calculation
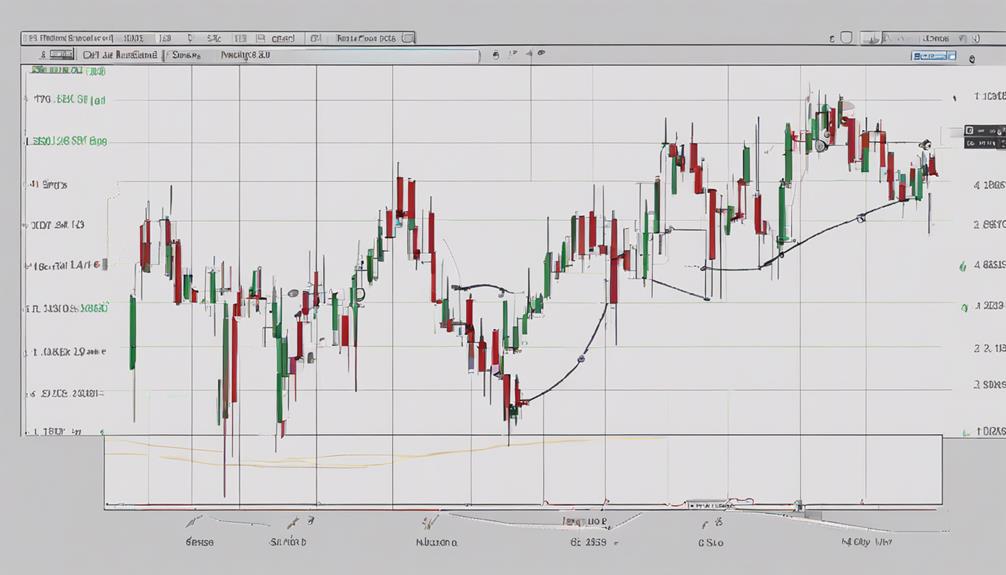
To accurately set up Bollinger Bands, one must first understand the calculation of Band Width, which signifies the range of market volatility based on the difference between the Upper and Lower Bollinger Band values. Band Width is important in evaluating the width of the Bollinger Bands, reflecting market volatility levels. A wider Band Width implies higher volatility, while a narrower Band Width indicates lower volatility. Traders utilize Band Width to pinpoint potential trend changes or breakout points in price movement. Mastering the calculation and interpretation of Band Width is essential for effectively leveraging Bollinger Bands in trading strategies.
| Bollinger Band Component | Calculation |
|---|---|
| Upper Bollinger Band | Moving Average + (2 x Standard Deviation) |
| Lower Bollinger Band | Moving Average – (2 x Standard Deviation) |
| Band Width | Upper Bollinger Band – Lower Bollinger Band |
Selecting Period Settings
Selecting ideal period settings for Bollinger Bands is a critical aspect of setting up this technical analysis tool effectively for trading purposes. The default period setting is commonly 20 periods, but traders have the flexibility to adjust this parameter to customize the sensitivity of the Bollinger Bands to market volatility.
Shorter periods, such as 9-12 periods, increase responsiveness to price changes, while longer periods provide a smoother representation of price movements. By experimenting with different period settings, traders can find the best balance between responsiveness and reliability in their Bollinger Bands.
These adjustments not only impact the width and positioning of the bands but also influence the signals generated, aiding in identifying potential trading opportunities through customization.
Interpretation of Width
Understanding the significance of Bollinger Bands Width is pivotal in correctly configuring this technical analysis tool for effective market interpretation.
The Bollinger Bands Width serves as a measure of market volatility, with Width expansion indicating increased volatility and potential trading opportunities, while Width contraction suggests decreased volatility and potential consolidation or range-bound conditions.
Setting parameters such as the 20-period moving average and 2 standard deviations is essential for accurate Width interpretation.
By analyzing changes in Width, traders can anticipate price movements more effectively and make informed trading decisions.
Therefore, a thorough understanding of Bollinger Bands Width and its implications is crucial for traders seeking to navigate market fluctuations with precision and insight.
Interpreting Bollinger Band Width
The Bollinger Band Width serves as a critical indicator for traders seeking to gauge market volatility levels. Understanding the significance of Band Width enables market participants to interpret the potential for price movements accurately.
As a volatility measurement tool, the Band Width provides valuable insights into market dynamics and potential trading opportunities.
Width Significance Explained
In evaluating market volatility and potential price movements, the interpretation of Bollinger Band Width plays an essential role for traders.
- Bollinger Band Width measures the distance between the upper and lower bands, providing insights into market volatility levels.
- A low Band Width signifies low volatility and possible consolidation, while a high Band Width indicates increased volatility and potential price shifts.
- Traders utilize Band Width to anticipate potential breakouts or trend reversals based on the level of volatility present in the market.
Understanding Bollinger Band Width is vital for evaluating trend strength and predicting significant price changes. Monitoring changes in Band Width over time offers valuable information on market sentiment shifts and potential trading opportunities.
Volatility Measurement Tool
Utilizing Bollinger Band Width as a key tool for measuring volatility provides traders with valuable insights into market dynamics and potential price movements. The Band Width, calculated as the distance between the upper and lower bands divided by the middle band (MA), serves as an important indicator of market volatility. A narrow Band Width indicates low volatility levels, while a wide Band Width suggests high volatility in the market. By interpreting the Band Width, traders can anticipate potential price movements and identify trading opportunities based on the prevailing market conditions. Understanding the Band Width allows traders to make informed decisions, aligning their strategies with the varying levels of volatility for best trading outcomes.
| Bollinger Band Width | Interpretation |
|---|---|
| Narrow | Low volatility |
| Wide | High volatility |
| Anticipate | Potential price movements |
| Trading opportunities | Based on market volatility levels |
| Informed decisions | Utilizing Band Width for best trades |
Using Bollinger Bands for Volatility Measurement
When utilizing Bollinger Bands for volatility measurement, traders rely on the Band Width calculation to assess market volatility dynamics. This calculation helps traders understand the level of volatility present in the market, allowing them to make informed decisions regarding their trading strategies and risk management. Here are three key aspects to bear in mind when using Bollinger Bands for volatility measurement:
- Band Width Calculation: The Band Width is determined by calculating the numerical difference between the upper and lower bands of the Bollinger Bands. This value provides insight into the current level of volatility in the market.
- Interpreting Band Width: Wider bands indicate higher volatility, suggesting increased price fluctuations, while narrower bands signal lower volatility, indicating more stable price movement.
- Utilizing Band Width for Risk Management: Traders can use the Band Width to identify periods of heightened volatility, enabling them to adjust their risk management strategies accordingly to protect their positions.
Understanding how to effectively interpret the Band Width of Bollinger Bands is essential for traders seeking to navigate and capitalize on the ever-changing dynamics of the market.
Implementing Double Bottom Strategy
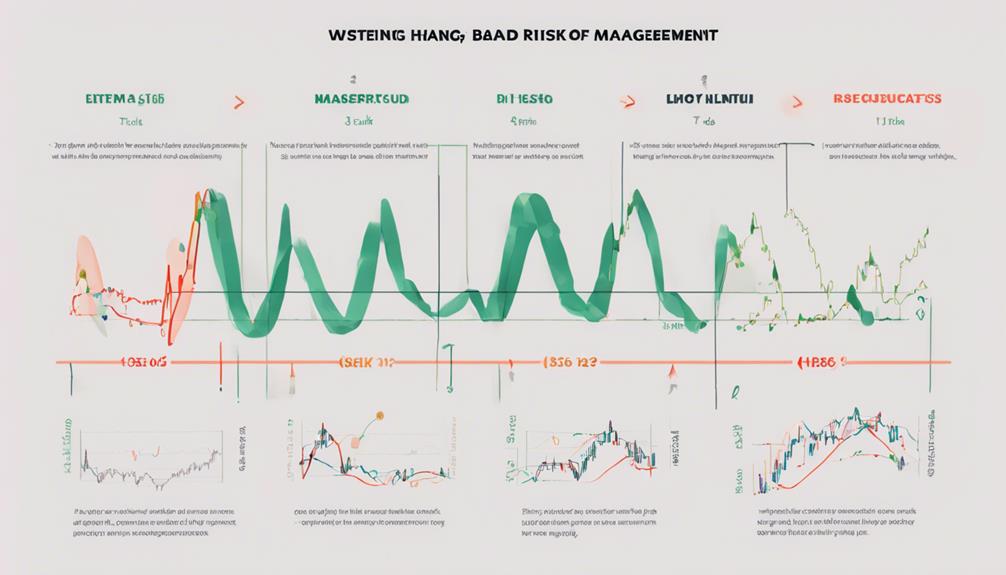
The Double Bottom Strategy focuses on identifying a distinct 'W' pattern on the Bollinger Bands chart, indicating a potential bullish reversal. Traders typically wait for two consecutive lows that are approximately equal to form this pattern before considering entry and exit points.
Proper risk management techniques are essential when implementing the Double Bottom Strategy to enhance trade precision and minimize potential losses.
Double Bottom Formation
Implementing the double bottom strategy within the context of Bollinger Bands enhances traders' ability to pinpoint favorable entry and exit points, leveraging the pattern's bullish reversal indications.
Key Points:
- Double bottom formation consists of two troughs at similar price levels, signaling a potential bullish reversal.
- Traders confirm the pattern with a breakout above the intermediate high between the troughs.
- The pattern suggests a shift from a downtrend to an uptrend, presenting buying opportunities.
Combining the double bottom formation with Bollinger Bands allows traders to monitor price action around the lower band for a bounce, aiding in identifying prime entry points for profitable trades.
Entry and Exit
Strategically incorporating the Double Bottom Formation within a trading framework enhances the ability to optimize entry and exit points with precision and confidence. This strategy involves identifying two consecutive low points in price action, with the entry point signaled when the price breaks above the high between the two lows.
Utilizing Bollinger Bands can further confirm these entry and exit points. To manage risk effectively, traders can set a stop loss below the lowest low of the pattern. The target for the trade is commonly set at a distance equal to the height of the pattern.
Risk Management
Utilizing the Double Bottom Strategy in conjunction with Bollinger Bands offers traders a structured approach to managing risk while identifying potential trend reversals.
Key Points:
- Identifying Double Bottom: Look for two consecutive lows at a similar price level on the Bollinger Bands, signaling a possible trend reversal.
- Confirmation Signal: Wait for a price reversal signal after the second low before evaluating entering a long position.
- Risk Management: Set stop-loss orders below the lowest point of the Double Bottom pattern as a safeguard against false breakouts and manage potential losses effectively.
Implementing this strategy can provide traders with a clear framework for entering and exiting trades while keeping risk at manageable levels.
Riding the Bollinger Bands
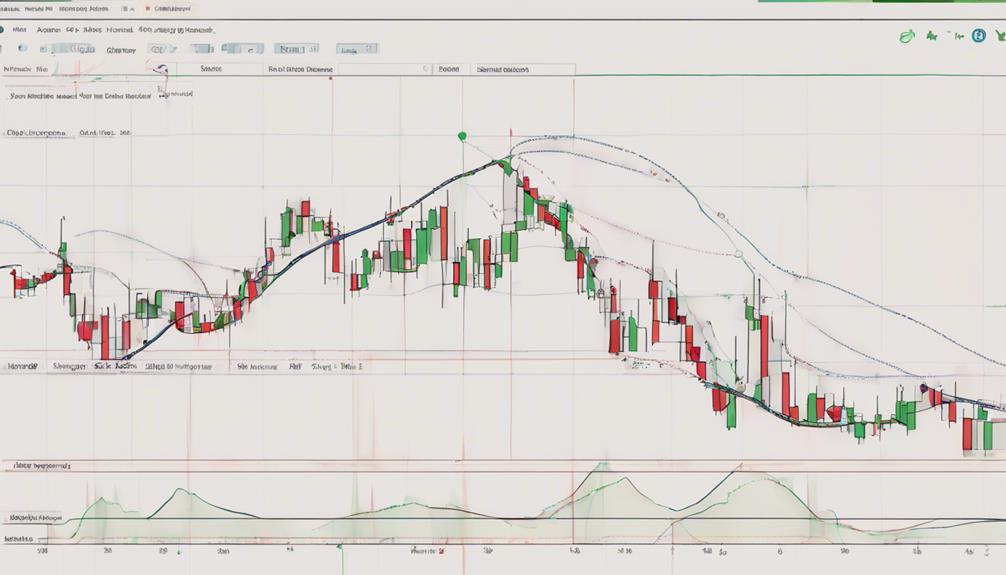
When applying the riding the Bollinger Bands strategy, traders seek to capitalize on price movements by buying at the lower band and selling at the upper band to take advantage of mean reversion or price fluctuation within the bands. This approach involves closely monitoring when the price touches the lower or upper bands of the Bollinger Bands indicator.
Additionally, traders can use the Relative Strength Index (RSI) to confirm potential oversold or overbought conditions before entering trades based on the bands' signals. Proper risk management is essential when riding the bands, which includes setting stop-loss orders to protect profits and mitigate losses.
Considering the broader market trend and momentum can further enhance the effectiveness of the riding the Bollinger Bands strategy. By incorporating these elements into their trading approach, traders can potentially improve their decision-making process and optimize their trading outcomes.
Enhancing Accuracy With Risk Management
Implementing proper risk management techniques is crucial for enhancing the accuracy of Bollinger Band Width analysis. To maximize the effectiveness of your trading strategy, consider the following risk management practices:
- Utilize Stop Loss Orders: Setting stop loss orders based on support and resistance levels can help limit potential losses and protect your capital in case the trade moves against your position.
- Maintain a Favorable Risk-Reward Ratio: Employing a risk-reward ratio of 1:2 or 1:3 ensures that the potential reward outweighs the risk taken in each trade, leading to improved profitability over the long term.
- Implement Trailing Stops: Using trailing stops allows you to lock in profits as the trade progresses in your favor, safeguarding your gains while giving the trade room to develop further.
Applying Bollinger Bands in Swing Trading
Bollinger Bands play a significant role in swing trading by aiding traders in identifying potential entry and exit points within a trend.
Swing traders leverage Bollinger Band Width to assess market volatility and pinpoint breakout opportunities.
Utilizing Bollinger Bands effectively in swing trading involves strategically observing price interactions with the bands to make informed trading decisions.
Swing Trade Basics
Swing trading is a strategy focusing on capturing short- to medium-term price movements. It incorporates the use of Bollinger Bands to assist traders in identifying potential entry and exit points based on market volatility.
When applying Bollinger Bands in swing trading, traders should consider the following:
- Utilizing market volatility: Bollinger Bands help gauge market volatility, offering insights into potential trade opportunities.
- Emphasizing price action: Understanding price action within the bands is essential for making effective trading decisions.
- Capturing trends: Swing traders aim to capture a portion of a trend, rather than the entire move, using Bollinger Bands to pinpoint entry and exit points efficiently.
Timing Entry Points
With a focus on precision and strategic analysis, the utilization of Bollinger Bands for timing entry points in swing trading proves to be a valuable asset for traders seeking to navigate market volatility effectively. Bollinger Band Width serves as a key indicator for identifying volatility levels, essential for determining entry and exit points in swing trading strategies.
Monitoring Band Width fluctuations allows traders to gauge market conditions, with narrow Band Width indicating low volatility and the potential for breakouts or trend continuations. Conversely, widening Band Width signals increased volatility, suggesting possible reversals or strong momentum shifts.
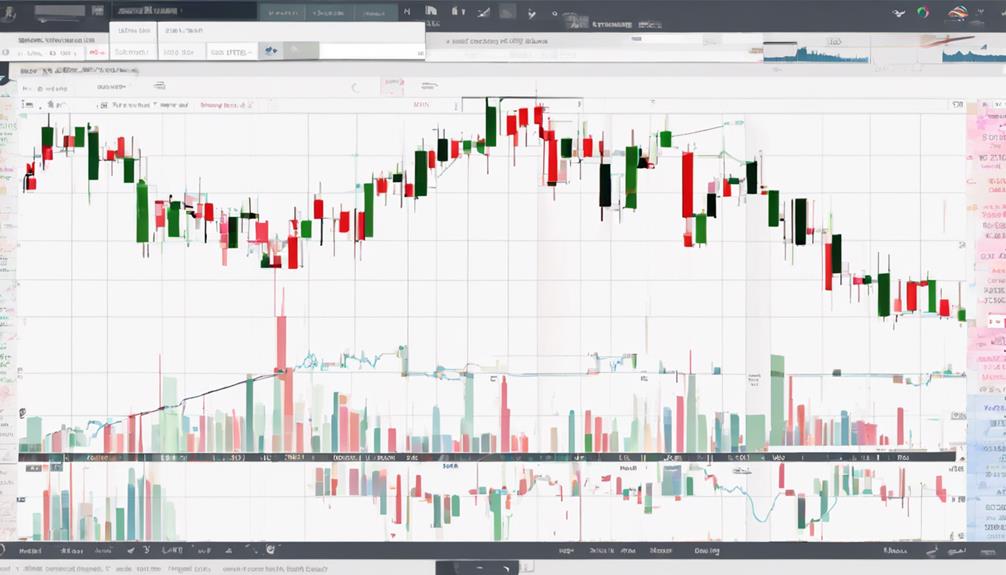
Bollinger Bands for Day Trading
Utilizing Bollinger Bands in day trading involves leveraging intraday price movements to inform short-term trading decisions effectively. Day traders can benefit from the versatility of Bollinger Bands tailored for specific time frames, enabling a focus on short-term price action.
Here are three key points to take into account when using Bollinger Bands for day trading:
- Identifying Volatility and Breakouts: Bollinger Bands help day traders spot periods of heightened volatility and anticipate potential price breakouts, aiding in timely decision-making during the trading day.
- Enhancing Strategies with RSI: Combining Bollinger Bands with indicators like the Relative Strength Index (RSI) can provide additional confirmation signals, enhancing the robustness of day trading strategies.
- Setting Stop-Loss Levels: Day traders utilize Bollinger Bands to establish effective stop-loss and take-profit levels based on intraday price fluctuations, helping manage risk and optimize trade outcomes efficiently.
Mastering Double Bollinger Band Strategy
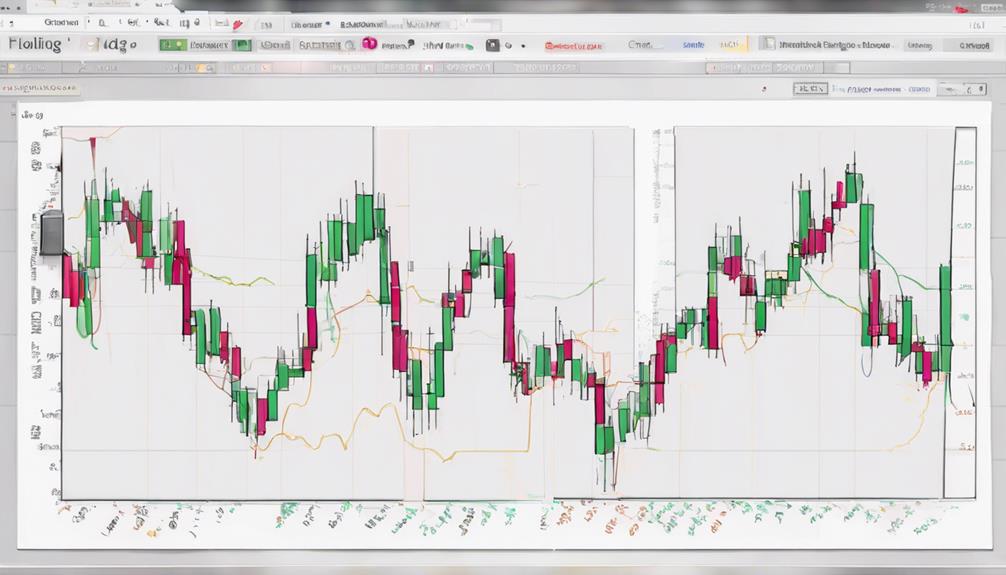
Incorporating the Double Bollinger Band Strategy into trading methodologies enhances traders' ability to capture significant market trends and effectively navigate market volatility. This strategy involves using two Bollinger Bands sets, where one set is configured with a standard deviation of 2 to identify the overall trend, and the other set with a standard deviation of 1 to pinpoint entry and exit points.
Traders rely on price action bouncing off the inner bands of the Double Bollinger Bands to confirm trend reversals or continuations. This approach is particularly effective in capturing strong trending moves while filtering out market noise.
Executing Buy Low and Sell High
To effectively execute the buy low and sell high strategy using Bollinger Bands, traders focus on identifying ideal entry and exit points based on price movements relative to the bands. Here are three key points to contemplate:
- Utilize Reversal Points: Look for instances when the price touches the lower Bollinger Band as a potential buy signal and the upper band as a sell signal. These points can indicate potential trend reversals.
- Assess Market Volatility: Use the Bollinger Band Width, which expands during periods of high volatility and contracts during low volatility. Understanding market volatility can help in determining the likelihood of price movements.
- Maintain a Disciplined Approach: Stick to predefined trading rules and strategies to avoid emotional decision-making. Setting stop-loss orders and profit targets can help in managing risk and maximizing returns.
Rules for Bollinger Bands Trading
When engaging in Bollinger Bands trading, a systematic approach based on established rules is essential for making informed decisions and maximizing trading effectiveness. Understanding Bollinger Band Width is vital as it provides insights into market volatility. Traders can utilize Band Width to identify periods of low volatility that often precede potential high volatility breakouts. A narrow Band Width indicates low volatility, while a widening Band Width suggests increasing volatility, influencing trading strategies and price movements.
| Rules for Bollinger Bands Trading |
|---|
| 1. Monitor Band Width fluctuations to anticipate volatility changes. |
| 2. Use narrow Band Width to prepare for potential breakout trades. |
| 3. Adjust trading strategies based on Band Width trends. |
Best Bollinger Bands Settings
Building upon the foundation of understanding Bollinger Band Width and its significance in evaluating market volatility, determining the best settings for Bollinger Bands is pivotal for optimizing trading strategies and decision-making processes.
When considering the best Bollinger Bands settings, certain factors need to be taken into account:
- Default Recommendations: John Bollinger recommends using 20 periods and 2 standard deviations as the default settings for Bollinger Bands, which are widely accepted in the trading community for their balance of sensitivity and reliability.
- Customization for Trading Styles: Traders can adjust the period length and standard deviation multiplier to align with their specific trading styles and preferences. This customization can enhance the effectiveness of Bollinger Bands in different market scenarios.
- Beneficial for Scalping Strategies: Fine-tuning the Bollinger Bands settings can be particularly advantageous for scalping strategies and analyzing shorter timeframes efficiently. Experimenting with different settings allows traders to tailor Bollinger Bands to suit the characteristics of specific assets and prevailing market conditions.
Final Thoughts on Bollinger Band Width
In conclusion, a comprehensive comprehension of Bollinger Band Width is crucial for traders seeking to effectively evaluate market volatility and make well-informed trading decisions. Bollinger Band Width serves as a valuable tool for analyzing the intensity of price movements and potential trend changes in the market. By monitoring Band Width fluctuations, traders can pinpoint periods of high and low volatility, enabling them to adapt their trading strategies accordingly. Extreme values in Band Width can serve as indicators of significant price breakouts or reversals, offering traders valuable insights for decision-making. Integrating Bollinger Band Width into one's trading arsenal can improve the ability to interpret market dynamics and make timely moves to capitalize on trading opportunities. By staying alert to Band Width variations, traders can better navigate the intricacies of the market and optimize their trading strategies for enhanced results.
| Key Points | Importance |
|---|---|
| Market Volatility | Gauge intensity of price movements |
| Trend Changes | Identify potential shifts in market direction |
| Trading Strategies | Adjust approaches based on Band Width fluctuations |
Can Bollinger Band Width Mastery Help Improve My Understanding of Bollinger Bands and RSI?
Yes, understanding Bollinger Band Width Mastery can definitely enhance your grasp of the bollinger bands and rsi synergies. Mastering the band width can help you better interpret the relationship between the two indicators and make informed trading decisions.
Frequently Asked Questions
How Do You Calculate the Width of a Bollinger Band?
The width of a Bollinger Band is calculated by measuring the distance between the upper and lower bands, determined by the Bollinger Bandwidth Formula.
This width is essential for evaluating market conditions and potential trading opportunities. By analyzing standard deviation, historical volatility, and price fluctuations, traders can interpret the band width to gauge market volatility, evaluate trading ranges, and make informed decisions based on price volatility measurements.
What Is the Best Strategy for Bollinger Bands?
The best strategy for Bollinger Bands involves utilizing a combination of entry points, exit signals, risk management, volatility analysis, trend confirmation, position sizing, and market conditions.
How to Use BB Width?
Bollinger Band Width offers valuable insights for traders by indicating market volatility levels, aiding in trend identification and risk management. Utilize it for trading signals, volatility analysis, and indicator interpretation.
Adjust position sizing and stop loss placement based on Band Width fluctuations to optimize risk-reward ratios. Acknowledging these aspects enhances decision-making and strategy effectiveness in managing dynamic market conditions.
What Is the Best Timeframe for Bollinger Bands?
The ideal settings for Bollinger Bands involve selecting a time frame that aligns with one's trading goals and risk tolerance. Shorter time frames like 5 or 10 periods offer more frequent trading signals but may result in increased noise.
Longer time frames such as 50 or 100 periods provide smoother trend analysis but could lag behind price movements. Traders should consider the balance between responsiveness and reliability based on the asset being analyzed.
Conclusion
To sum up, mastering Bollinger Band Width requires a clear understanding of the tool, correct setup, and interpretation. Utilizing Bollinger Bands for volatility measurement, implementing strategies like double bottom, and adhering to trading rules are essential for success.
By using the best Bollinger Bands settings, traders can effectively buy low and sell high. In the volatile world of trading, mastering Bollinger Band Width can provide a strategic advantage for maneuvering market fluctuations with precision and confidence.