
Master key momentum indicators like Relative Strength Index (RSI), Average Directional Index (ADX), Commodity Channel Index (CCI), and Moving Average Convergence Divergence (MACD). Supplement with Momentum Indicator, Stochastic Oscillator, Ichimoku Cloud, Bollinger Bands, and Fibonacci Retracement for a thorough toolkit. These indicators gauge market strength, trend direction, overbought/oversold conditions, and potential reversals essential for strategic trading. By incorporating these tools, traders can analyze price movements effectively and improve decision-making. Explore these top 10 momentum indicators to enhance your trading skills and stay ahead in the dynamic market landscape.
Relative Strength Index (RSI)
How does the Relative Strength Index (RSI) effectively measure market strength and signal potential trend reversals for traders?
The RSI is a powerful momentum oscillator that quantifies the strength of price movements on a scale of 0 to 100. By comparing the average gains and losses over a specified period, the RSI identifies when a market is overbought, typically above 70, or oversold, usually below 30.

This information is crucial for traders as it can indicate potential trend reversals. When the RSI indicates an overbought condition, it suggests that the market may be due for a pullback or correction. Conversely, an oversold reading implies that a potential upward reversal could be on the horizon. Traders utilize these signals to make informed decisions on when to enter or exit trades.
Additionally, the RSI helps in analyzing the speed and magnitude of price changes, providing valuable insights for crafting effective trading strategies.
Average Directional Index (ADX)
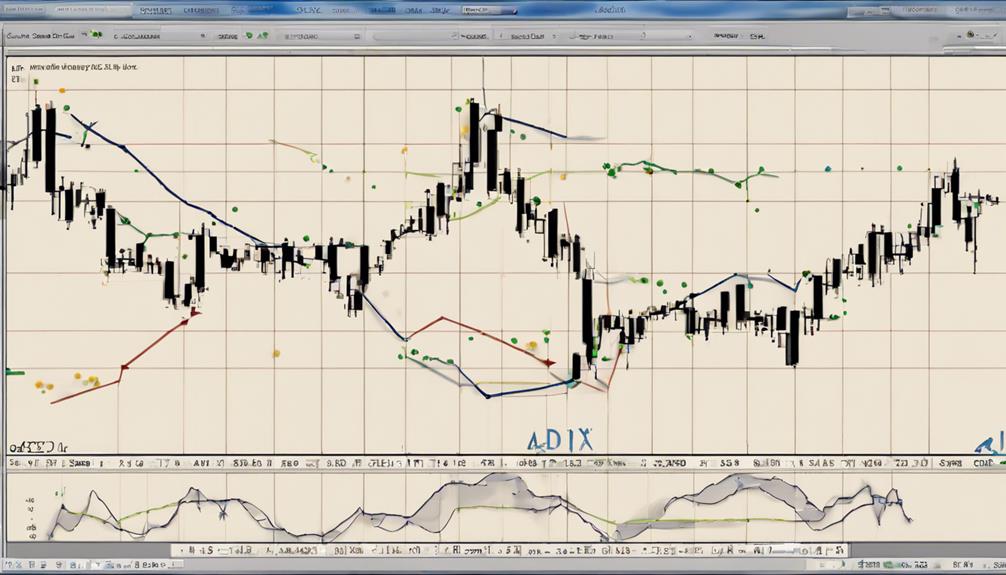
The Average Directional Index (ADX) is a technical indicator used to evaluate the strength of a trend in a financial instrument.
By calculating the difference between two consecutive lows and highs, the ADX provides traders with a numerical value that ranges from 0 to 100.
Values above 25 are typically interpreted as a strong trend, indicating potential trading opportunities based on trend strength.
ADX Calculation Method
Utilizing a sophisticated calculation method, the Average Directional Index (ADX) quantifies trend strength by combining positive and negative directional movements. This process involves averaging the positive and negative directional movements and then smoothing the resulting index using Wilder's smoothing technique.
By doing so, ADX effectively filters out market noise, providing a clearer indication of the underlying trend's strength. The ADX values range from 0 to 100, with readings above 25 suggesting a strong trend and values below 20 indicating weak trends or ranging market conditions.
Traders often rely on ADX values above 40 to identify very strong trends and potential continuation signals. Additionally, ADX is commonly used alongside indicators like the Directional Movement Index (DMI) to confirm trend strength and locate potential entry or exit points in the market.
Interpreting ADX Values
In trading analysis, interpreting ADX values is essential for evaluating trend strength and potential market entry or exit points. ADX values range from 0 to 100, with higher values indicating stronger trends and lower values indicating weaker trends. A rising ADX signifies a strengthening trend, while a falling ADX implies a weakening trend.
Typically, ADX values above 25 suggest a robust trend, whereas values below 20 indicate a weak trend or a ranging market. Traders often combine ADX values with other indicators to confirm trend strength and determine best entry and exit points. This indicator is particularly valuable for trend-following strategies, assisting traders in maneuvering through choppy or sideways markets effectively.
Commodity Channel Index (CCI)
The Commodity Channel Index (CCI) provides traders with a numerical representation of an asset's deviation from its average price. By calculating this variation, traders can identify potential entry and exit points based on overbought and oversold conditions.
With values exceeding +100 signaling overbought levels and values below -100 indicating oversold levels, traders can leverage CCI to anticipate market reversals and make informed trading decisions.
CCI Calculation Method
Calculated by deriving the difference between the typical price and its simple moving average, the Commodity Channel Index (CCI) normalizes this value by dividing it by the mean absolute deviation (MAD).
The typical price, an average of high, low, and close prices over a specific period, serves as the basis for CCI calculations. Traders utilize CCI to gauge overbought (+100) and oversold (-100) conditions, indicating potential price reversals.
By normalizing the index through MAD, CCI helps identify market extremes, aiding traders in making informed decisions. Understanding the CCI calculation method is essential for interpreting this momentum indicator accurately and effectively in trading strategies.
This analytical approach to CCI calculation enhances traders' ability to navigate market trends and capitalize on trading opportunities.
CCI Signal Interpretation
Utilized by traders to assess price movements, the Commodity Channel Index (CCI) serves as a valuable tool in identifying overbought and oversold conditions in the market.
When the CCI rises above +100, it indicates overbought conditions, suggesting that the asset price may be due for a downward correction. Conversely, when the CCI falls below –100, it signifies oversold conditions, implying a potential upward price correction.
Traders utilize these CCI signals to make informed decisions about entering or exiting trades. By combining CCI interpretations with other technical indicators, traders can enhance their trading strategies by confirming buy or sell signals and identifying potential trend reversals.
The CCI's adaptability makes it a popular choice across various trading styles and market conditions.
Moving Average Convergence Divergence (MACD)
An essential momentum indicator used by traders is the Moving Average Convergence Divergence (MACD), which compares two moving averages to evaluate trend changes and momentum shifts. The MACD is a versatile tool that provides valuable insights into market dynamics.
Here are three key points about MACD:
- Signal Generation: MACD generates buy and sell signals based on crossovers between the MACD line and the signal line. These crossover points indicate potential shifts in momentum, guiding traders on entry and exit points.
- Histogram Visualization: The MACD histogram illustrates the variance between the MACD line and the signal line. This visual representation helps traders quickly assess the strength of a trend or potential reversals in the market.
- Confirmation and Reversal: Traders often use MACD in conjunction with support and resistance levels to confirm existing trends or identify possible trend reversals. By analyzing the MACD's movements around these key levels, traders can make informed trading decisions.
Momentum Indicator
Momentum indicators play a crucial role in evaluating the speed and strength of price movements within currency pairs. These indicators measure the momentum behind price changes by comparing current prices to historical prices.
By analyzing this momentum, traders can identify market trends and assess the strength of those trends. Momentum indicators provide valuable insights into the direction in which a market is moving and can help traders anticipate potential trend reversals.
Some popular momentum indicators used by traders include the Relative Strength Index (RSI), Average Directional Index (ADX), Stochastic Oscillator, Moving Averages, and Moving Average Convergence Divergence (MACD).
Utilizing these indicators can assist traders in making informed decisions based on the momentum of the market, allowing them to capitalize on trends and manage risk effectively. Understanding and interpreting momentum indicators are essential skills for traders seeking to navigate the dynamic nature of the financial markets.
Rate of Change (ROC)
Rate of Change (ROC) is a fundamental momentum indicator that quantifies the percentage change in price over a specified period. Traders often rely on the ROC calculation method to assess the velocity of price movements and determine potential trend shifts.
Understanding the interpretation of ROC values and implementing effective trading strategies based on these insights can help traders navigate market dynamics with more informed decision-making.
ROC Calculation Method
The calculation method for ROC, known as Rate of Change, is a key tool used by traders to assess price momentum. ROC calculates the percentage change in price over a specified period, providing insights into the momentum of price movements.
Here are three key aspects of ROC calculation method:
- Historical Price Comparison: ROC compares the current price to a past price to determine the percentage change.
- Momentum Identification: It helps traders identify increasing or decreasing momentum in price movements.
- Confirmation and Prediction: Traders use ROC to confirm trends, detect divergences, and anticipate potential price reversals.
These elements make ROC a popular and valuable momentum indicator for traders analyzing price dynamics.
Interpretation of ROC
Interpreting Rate of Change (ROC) involves analyzing the percentage change in price over a specific timeframe to gauge the velocity of price movements. ROC, as a momentum indicator, calculates the percentage change between the current closing price and a previous closing price.
Positive ROC values indicate upward momentum, while negative values signify downward momentum in the market. Traders utilize ROC to confirm existing trends, spot potential reversals, and assess the strength of price movements.
ROC Trading Strategies
Utilizing Rate of Change (ROC) in trading strategies provides traders with a valuable tool for evaluating price momentum dynamics and making well-informed decisions. Traders can employ ROC trading strategies to capitalize on momentum shifts and enhance their trading performance.
Here are three key aspects to take into account when implementing ROC trading strategies:
- Identifying Momentum Reversals: ROC helps traders spot potential trend reversals by observing changes in the rate of price movements.
- Setting Effective Stop-Loss Levels: Incorporating ROC into stop-loss placement can assist traders in managing risk and protecting profits during volatile market conditions.
- Confirming Divergence Signals: Using ROC alongside other technical indicators can strengthen signals and provide confirmation for making trading decisions.
Stochastic Oscillator
Analyzing price momentum through the Stochastic Oscillator provides traders with valuable insights into market conditions and potential entry or exit points. The Stochastic Oscillator compares the current closing price of an asset to its price range over a specific period, usually 14 periods.
By generating values between 0 and 100, it signals oversold conditions when the reading falls below 20 and overbought conditions when it goes above 80. Traders utilize this tool to pinpoint potential entry and exit positions based on prevailing market conditions.
Additionally, the Stochastic Oscillator aids in evaluating support and resistance levels by monitoring the momentum of price movements. Due to its ability to measure the speed and direction of price changes, the Stochastic Oscillator stands as a favored instrument among traders seeking to interpret market dynamics effectively.
Ichimoku Cloud

The Ichimoku Cloud indicator is a powerful tool that combines multiple lines to offer traders valuable insights into support, resistance, and trend direction in the market. This indicator consists of five components: Tenkan-sen, Kijun-sen, Senkou Span A, Senkou Span B, and Chikou Span.
Here are three key aspects of the Ichimoku Cloud that traders find particularly useful:
- Support and Resistance Levels: The cloud area between Senkou Span A and Senkou Span B serves as a visual representation of potential future support and resistance levels. Traders can use these levels to make informed decisions about entry and exit points.
- Trend Direction: By analyzing the relationship between the components of the Ichimoku Cloud, traders can determine the prevailing trend direction in the market. This insight helps them align their trades with the overall market momentum.
- Extensive Indicator: The Ichimoku Cloud is favored among traders for its extensive view of price action and trend dynamics. It provides a holistic perspective on market conditions, aiding in the identification of key reversal points and trend strength.
Bollinger Bands
Bollinger Bands, developed by John Bollinger in the 1980s, are a volatility indicator that comprises a simple moving average flanked by upper and lower bands based on standard deviations. These bands expand and contract in response to market volatility, providing traders with insights into potential price breakouts or pullbacks. By identifying overbought or oversold conditions, traders can anticipate trend reversals using Bollinger Bands. The width of the bands is a key factor as it can signal upcoming price movement, aiding traders in making informed decisions.
| Key Point 1 | Key Point 2 | Key Point 3 |
|---|---|---|
| Volatility Indicator | Created by John Bollinger | Based on standard deviations |
| Signals potential price breakouts | Identifies overbought/oversold conditions | Helps anticipate trend reversals |
Fibonacci Retracement
Utilizing Fibonacci Retracement, traders employ a technical analysis tool rooted in the Fibonacci sequence and ratios to pinpoint potential price reversal levels in the market. Here are three key points about Fibonacci Retracement that traders should consider:
- Identification of Support and Resistance Levels:
Fibonacci Retracement helps traders identify key support and resistance levels by analyzing historical price movements. These levels indicate where the price could potentially reverse or consolidate, aiding traders in making well-rounded decisions.
- Setting Profit Targets and Stop-Loss Levels:
By using Fibonacci Retracement, traders can anticipate where price retracements may occur and set profit targets and stop-loss levels accordingly. This allows for effective risk management and helps maximize potential profits.
- Confirmation with Other Technical Indicators:
Traders often combine Fibonacci Retracement with other technical indicators to validate trading signals. This integrated approach enhances the accuracy of predictions and assists traders in executing well-informed trades based on thorough analysis.
How Can Momentum Indicators Help in Evaluating Healthcare Dividend Stocks?
When considering where to invest, healthcare dividend stocks can be appealing due to their stability and potential for passive income. Investors can use momentum indicators, such as the Relative Strength Index (RSI) or Moving Average Convergence Divergence (MACD), to evaluate the strength of a stock’s trend and make informed decisions.
Frequently Asked Questions
What Is the Most Accurate Momentum Indicator?
The Relative Strength Index (RSI) stands out as one of the most accurate momentum indicators due to its ability to gauge overbought and oversold conditions effectively. Traders rely on RSI for spotting trend reversals and using entry/exit signals.
Its popularity stems from its capacity to measure price momentum accurately. Real-time applications of RSI include identifying divergences and confirming price trends.
Historical performance indicates RSI's reliability, making it a key tool for future trend predictions.
What Are the 5 Momentum Indicators?
When exploring momentum indicators, traders often turn to key tools such as Relative Strength, Stochastic Oscillator, and Moving Average Convergence Divergence (MACD). These indicators offer valuable insights into market trends, strength, and potential reversals.
What Is the Most Powerful Indicator in Trading?
The Relative Strength Index (RSI) is widely regarded as one of the most powerful technical analysis tools in trading due to its ability to measure market psychology and identify overbought or oversold conditions.
By incorporating RSI into trading strategies, traders can effectively manage risk and make informed decisions based on price action and trend reversals.
Utilizing RSI alongside other indicators can enhance market analysis and improve overall trading performance.
What Is the Mom of the Momentum Indicator?
The Mom of the Momentum Indicator is a metric derived from calculating the rate of change in the Momentum Indicator itself. It is utilized in technical analysis to assess historical price movements and market trends.
Conclusion
To sum up, mastering the top 10 momentum indicators is vital for traders looking to navigate the volatile waters of the market. Like a skilled sailor relying on the constellations to guide their ship, understanding these indicators can provide clarity and direction in the ever-changing world of trading.
By harnessing the power of these tools, traders can increase their chances of success and navigate the market with confidence and precision.
