
Understanding trend following indicators is essential for beginners in trading. Analyze price movements using indicators like trendlines, moving averages, MACD, and RSI. Identify trend types like uptrends, downtrends, and sideways trends for tailored strategies. Emphasize market alignment, risk management, and stop-loss orders for effective trading. Utilize Moving Averages, MACD, Bollinger Bands, RSI, and Parabolic SAR to assess trend strength and potential changes. Precision in entry and exit points, incorporating multiple indicators for confirmation. Diversify the portfolio and manage risks effectively across asset classes. Utilize tools like EMA crossovers, ADX, and MACD for informed decisions. *Enhance your knowledge of mastering trend following indicators for successful trading.*
Identifying Market Trends
To effectively navigate financial markets, the initial step for traders is to proficiently identify and discern prevailing market trends. Trend identification involves analyzing the price movement to determine the direction in which the market is heading. Traders utilize various indicators such as trendlines, moving averages, MACD, and RSI to confirm the existence of a trend and its strength. By observing whether the market is forming higher highs and lower lows (uptrend) or lower highs and lower lows (downtrend), traders can gain insight into the market's momentum.
Understanding the direction and strength of a trend is essential for making informed trading decisions. Traders aim to enter positions in alignment with the identified trend to maximize profit potential. Additionally, monitoring risk levels and adjusting position sizes are vital risk management practices when following trends to mitigate potential losses. By effectively identifying market trends using a combination of technical indicators, traders can enhance their trading strategies and improve their overall performance in the financial markets.

Types of Trend Characteristics
Within financial markets, trend characteristics encompass distinct patterns of price movement, including uptrends, downtrends, and sideways trends. Uptrends are identified by the presence of higher highs and higher lows, indicating a bullish market sentiment and upward momentum in prices. Conversely, downtrends exhibit lower highs and lower lows, reflecting bearish sentiment and a decline in prices. Sideways trends, on the other hand, demonstrate a lack of clear direction in price movement, with prices fluctuating within a horizontal range without a strong upward or downward bias.
Recognizing and comprehending these different types of trend characteristics is essential for conducting effective trend analysis and making informed trading decisions. By understanding whether the market is in an uptrend, downtrend, or sideways trend, traders can tailor their strategies accordingly to capitalize on potential opportunities or manage risks associated with each type of trend. Mastering the identification and interpretation of these trend characteristics forms the foundation for successful trend following and trading in financial markets.
Key Principles of Trend Following
An essential foundation of successful trend following in financial markets lies in adhering to key principles that emphasize market alignment, risk management, and strategic decision-making. Trend followers use technical indicators to determine trend direction and align themselves with market momentum.
Risk management is vital, achieved through setting stop-loss orders to mitigate losses if the trend reverses. Proper position sizing is essential to guarantee that traders allocate an appropriate amount of capital to each trade based on their risk tolerance and portfolio size. Cutting losses short is a fundamental principle in trend following to protect capital.
Additionally, letting profits run allows traders to maximize gains by allowing winning trades to continue in strong market trends. By following these principles, traders can effectively navigate trends, reduce the risk of trading against prevailing market movements, and capitalize on profitable opportunities.
Trend Indicator Overview
Trend indicators play a vital role in evaluating market trends by analyzing data points and patterns. Understanding key trend indicators and how to interpret their signals is essential for traders looking to make informed decisions.
Key Trend Indicators
When analyzing market trends, understanding key trend indicators such as Moving Averages, MACD Indicator, Bollinger Bands, RSI, and Parabolic SAR is vital for making informed trading decisions. Moving Averages like SMA and EMA help assess trend strength and continuity.
The MACD Indicator measures the relationship between moving averages, signaling potential trend changes. Bollinger Bands identify overbought and oversold conditions, aiding in trend analysis and reversal predictions.
RSI compares recent gains to losses for determining overbought or oversold conditions, supporting trend analysis. Parabolic SAR visually confirms trend direction and potential reversals through dots placed above or below price bars.
Understanding these indicators is essential for implementing effective trend-following strategies in the market.
Interpreting Indicator Signals
How can investors accurately interpret the signals provided by trend indicators to make informed decisions in the financial markets?
Moving averages offer insight into trend direction by smoothing out price fluctuations over a specified period.
MACD, by comparing two moving averages, indicates trend strength and potential trend changes through crossovers.
RSI, on the other hand, assesses whether a security is overbought or oversold based on recent price gains and losses.
By understanding these indicators and their signals, investors can gauge the momentum and potential reversal points within a market trend.
Effective interpretation of these signals is essential for traders looking to navigate the complexities of the financial markets and make well-informed trading decisions.
Entry Point Strategies
Effective entry point strategies in trend following involve precise timing of key market entries, allowing traders to capitalize on emerging trends.
Identifying potential trend reversals is vital for avoiding false signals and maximizing profit potential.
Utilizing a combination of multiple indicators can provide a more thorough confirmation of entry points, enhancing trading accuracy and overall performance.
Timing Key Market Entries
Optimizing market entries in trend following strategies demands a meticulous focus on identifying precise entry points for maximizing trade profitability. When timing key market entries, traders often rely on specific indicators like moving averages and MACD crossovers to pinpoint ideal entry opportunities.
Confirming the trend direction and strength is vital in selecting the right entry points. Additionally, utilizing entry signals based on price breakouts or trend reversals can greatly enhance the probability of successful trades.
It is essential to incorporate proper risk management practices, such as setting stop-loss orders, when determining entry points in trend following strategies. By mastering the art of timing key market entries, traders can enhance their trading performance and increase their chances of capturing profitable trades.
Identifying Trend Reversals
Identifying trend reversals in trading strategies involves utilizing indicators such as Moving Average Convergence Divergence (MACD), Relative Strength Index (RSI), and Parabolic SAR to pinpoint potential shifts in market direction.
Traders can look for MACD crossovers and divergences as signals of impending trend reversals. An RSI value below 30 indicates oversold conditions, suggesting a potential reversal to the upside. Additionally, the Parabolic SAR dots switching from above to below the price action may indicate a shift from a bearish to a bullish trend.
To enhance the accuracy of identifying trend reversal entry points, traders often combine multiple indicators for confirmation before making trading decisions. By carefully analyzing these indicators, traders can better anticipate and capitalize on trend reversals in the market.
Using Multiple Indicators
To improve trading decisions and enhance accuracy, integrating a variety of indicators for entry points is a prudent strategy employed by many experienced traders. When using multiple indicators for entry points, traders often combine moving averages with oscillators like RSI or MACD to confirm signals. This approach can help filter out false signals and provide more robust entry points.
By waiting for convergence or alignment of signals from different indicators, traders can increase their confidence in the trade setup. Utilizing a mix of trend-following indicators like moving averages with momentum indicators such as RSI or MACD can offer a holistic view of the market dynamics, aiding in making well-informed entry decisions.
- Combine moving averages with RSI or MACD for confirmation.
- Align signals from different indicators to validate trading decisions.
- Use a mix of trend-following and momentum indicators for a comprehensive analysis.
Exit Point Strategies
Exit strategies in trend following play a critical role in capturing profits and managing risk effectively. Traders utilize various techniques such as trailing stops, profit targets, and technical indicators to determine ideal exit points. By setting specific exit points, traders can secure gains as trends progress and shield themselves against potential reversals that could erode profits.
These strategies not only help in maximizing profits but also in mitigating losses by implementing a disciplined approach to exiting trades. Adaptive exit strategies are particularly valuable as they allow traders to adjust their exit plans according to changing market conditions, enabling them to optimize their trend-following performance.
Portfolio Diversification Techniques
Portfolio diversification is an essential strategy that involves spreading investments across various asset classes to minimize risk. By diversifying across different industries, geographies, and investment types, investors can lower the overall volatility of their portfolios.
Employing correlation analysis to identify assets that move independently can further enhance the benefits of diversification.
Asset Allocation Strategies
Implementing effective asset allocation strategies is essential for diversifying investment portfolios across different asset classes in order to mitigate risk and optimize returns. When contemplating asset allocation, traders should focus on techniques that align with their risk tolerance and investment goals. Here are key points to keep in mind:
- Diversification: Allocate investments across a range of asset classes to reduce exposure to any single market or sector.
- Rebalancing: Regularly review and adjust the portfolio to maintain the desired asset allocation mix.
- Long-Term Perspective: Take into account the investment horizon and adjust asset allocation strategies accordingly to meet long-term financial objectives.
Risk Management Tools
Effectively managing risk in investment portfolios requires the utilization of robust portfolio diversification techniques. Diversification involves spreading investments across different asset classes, industries, or regions to reduce risk and minimize the impact of losses from a single asset or market sector. Correlation analysis is crucial for determining how assets move in relation to each other. Proper portfolio diversification can enhance risk management by balancing potential returns and risks. Implementing diversification techniques is essential for mitigating concentration risk and achieving long-term investment goals.
| Portfolio Diversification Techniques | Benefits |
|---|---|
| Spread investments across different asset classes | Minimize risk |
| Invest in various industries and regions | Reduce impact of losses |
| Use correlation analysis to understand asset movements | Enhance risk management |
| Balance potential returns and risks | Achieve long-term investment goals |
| Mitigate concentration risk | Maintain portfolio stability |
Industry Sector Spread
Diversifying investments across various industry sectors is a strategic approach to reducing risk and maximizing potential returns in a portfolio.
When implementing sector spread for portfolio diversification, investors should consider the following:
- Sector Spread Benefits: By investing in industries like technology, healthcare, finance, consumer goods, and energy, investors can offset losses in one sector with gains in another, creating a balanced investment approach.
- Risk Mitigation: Industry sector diversification helps limit exposure to sector-specific risks and market fluctuations, enhancing overall portfolio stability.
- Market Monitoring: Effective portfolio diversification through industry spread requires monitoring sector performance regularly and adjusting allocations based on evolving market conditions.
Importance of Risk Management

Risk management plays a pivotal role in the domain of trend following, serving as a cornerstone for controlling losses and safeguarding capital in trading endeavors. Effective risk management involves elements such as position sizing tailored to individual risk tolerance levels and the strategic placement of stop-loss orders.
By implementing proper risk management strategies, traders can mitigate significant drawdowns, protect profits, and preserve capital. This is essential for achieving long-term trading success in trend following. Adhering to disciplined risk management practices is vital for maneuvering market uncertainties and maintaining consistency in trading strategies.
Traders who prioritize capital preservation through robust risk management techniques are better equipped to endure market fluctuations and enhance their overall trading success. Essentially, mastering risk management is fundamental for traders aiming to excel in the domain of trend following and secure sustainable profitability.
Simple Moving Average (SMA)
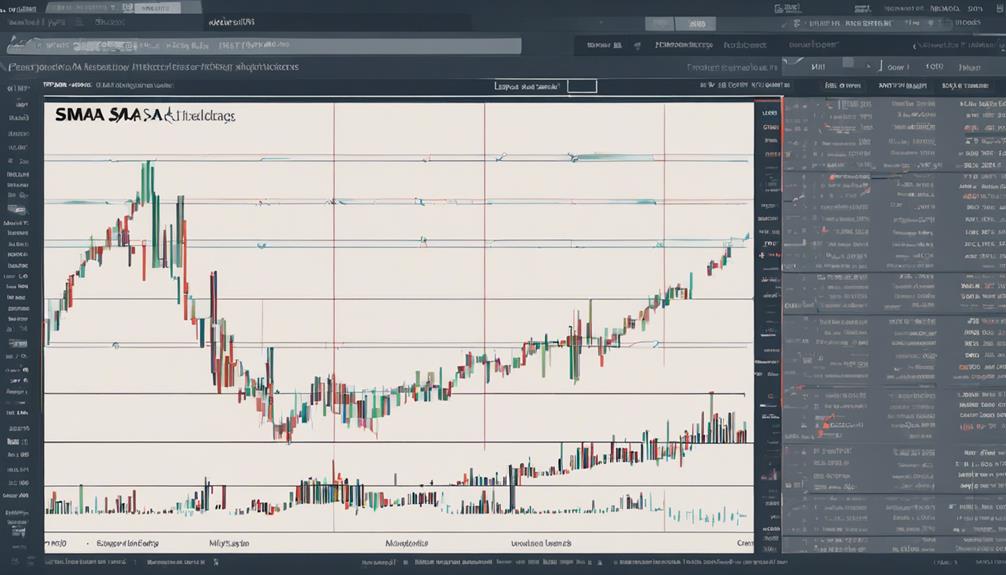
The Simple Moving Average (SMA) is a fundamental technical indicator widely utilized by traders and analysts to evaluate price trends and trend strength. When examining price movements, the SMA offers valuable insights into trend continuity, price direction, and potential reversals.
Here are key points to understand about the Simple Moving Average (SMA):
- Trend Strength Evaluation: SMA calculates the average price of an asset over a specific period, providing a clear trend line that helps traders evaluate the strength of a trend.
- Price Direction Identification: SMA is effective in identifying the direction of price movements, making it a valuable tool for traders looking to follow trends and make informed decisions.
- Trend Sustainability Assessment: By generating divergences with price movements, the SMA assists traders in gauging the sustainability of a trend and identifying potential reversals in the market.
Utilizing the Simple Moving Average can enhance traders' ability to interpret price trends effectively and make informed trading decisions.
Exponential Moving Average (EMA)
When analyzing market trends, the Exponential Moving Average (EMA) distinguishes itself by assigning greater significance to recent price data, offering traders a more responsive indicator compared to the Simple Moving Average (SMA).
The EMA's exponential smoothing technique emphasizes the most recent prices, making it particularly sensitive to current market conditions. Traders often utilize EMA crossovers to pinpoint potential trend changes, with shorter EMA periods reacting swiftly to price movements, providing timely signals.
For instance, when the 9-day EMA crosses above the 21-day EMA, it can indicate a bullish momentum shift in the market. EMA indicators, known for their versatility, can be effectively integrated into various trading strategies to capture and capitalize on trend movements efficiently in different market conditions.
Understanding and utilizing EMA crossovers and other EMA-based strategies can empower traders to make informed decisions and adapt to evolving market dynamics.
Average Directional Index (ADX/DMS)
Measuring trend strength and direction within a market, the Average Directional Index (ADX) serves as a valuable technical indicator for traders seeking to gauge the momentum of trends. The ADX is calculated by determining the variance between two smoothed price ranges, offering a numerical value that falls within the range of 0 to 100.
To provide further insight, here are three key points regarding the ADX and DMS combination:
- Trend Strength Evaluation: ADX values below 25 typically indicate a weak trend or a market moving sideways, while values exceeding 25 suggest an amplifying trend strength.
- Confirmation of Trend Presence: Traders often use the ADX alongside the Directional Movement System (DMS) to confirm the existence of a trend before making trading decisions.
- Range of Values: The ADX's scale from 0 to 100 allows traders to assess the strength of a trend objectively, aiding in the identification of potential entry and exit points based on the momentum observed.
Moving Average Convergence-Divergence (MACD)
A prevalent trend-following indicator utilized by traders to detect changes in momentum is the Moving Average Convergence-Divergence (MACD).
The MACD is calculated by finding the variance between two moving averages: the MACD line, derived from the faster moving average subtracted by the slower moving average, and the signal line, which is a moving average of the MACD line.
Traders rely on MACD crossovers, where the MACD line intersects the signal line, to generate buy or sell signals indicating potential shifts in momentum.
Additionally, the MACD histogram, illustrating the gap between the MACD line and the signal line, offers visual insights into the trend's strength.
Combining MACD with other indicators helps traders confirm trend directions and identify optimal entry or exit points in the market.
Frequently Asked Questions
What Is the Best Indicator for Trend Trading?
The best indicator for trend trading varies based on individual preferences and trading strategies. Moving Averages are commonly used for their simplicity in identifying trend direction and entry/exit points.
Relative Strength Index (RSI) helps assess market conditions. MACD histogram indicates trend strength and reversals. Bollinger Bands gauge price volatility.
Support resistance, Parabolic SAR, and Fibonacci retracement are additional tools for trend analysis, each offering unique insights into market trends.
What Are the Best Stock Indicators for Beginners?
When it comes to stock indicators for beginners, some essential tools include:
- Moving averages: help identify trends.
- Relative strength: measures trend strength.
- Bollinger bands: indicate trading range boundaries.
- MACD indicator: identifies trend direction changes.
- Price action, support resistance, and volume analysis: provide additional insights for beginners exploring the stock market.
What Is a Simple Trend-Following Strategy?
A simple trend-following strategy involves analyzing market trends using indicators like moving averages, price action, support resistance levels, and breakout strategies. Traders seek to confirm trends and identify best entry points aligned with the prevailing market direction.
What Is the Best EMA for Trend Trading?
When evaluating the best Exponential Moving Average (EMA) for trend trading, it is crucial to contemplate the EMA crossovers, especially the Golden Cross and Death Cross.
The selection between a shorter-term EMA like the 20-day or a longer-term EMA such as the 200-day depends on the trader's focus on short-term trends for responsiveness or long-term trends for reliability.
Traders often compare SMAs with EMAs to assess which indicator aligns better with their trend-following strategy.
Conclusion
To sum up, mastering trend following indicators is essential for maneuvering through the intricate world of financial markets.
By comprehending market trends, trend characteristics, and key principles of trend following, traders can effectively utilize trend indicators like SMA, EMA, ADX/DMS, and MACD to identify entry points and make informed trading decisions.
Keep in mind, in the ever-changing landscape of trading, staying ahead of the curve is vital to achieving success in the markets.
